Linear Function Models
Description
In this module students learn the properties of linear functions. They look at data sets, graphs of coordinates, and algebraic representations of functions. Then students go on a field trip to the US Mint to see how money is printed. From this they develop linear function models for calculating the number of bills printed, along with their dollar value.
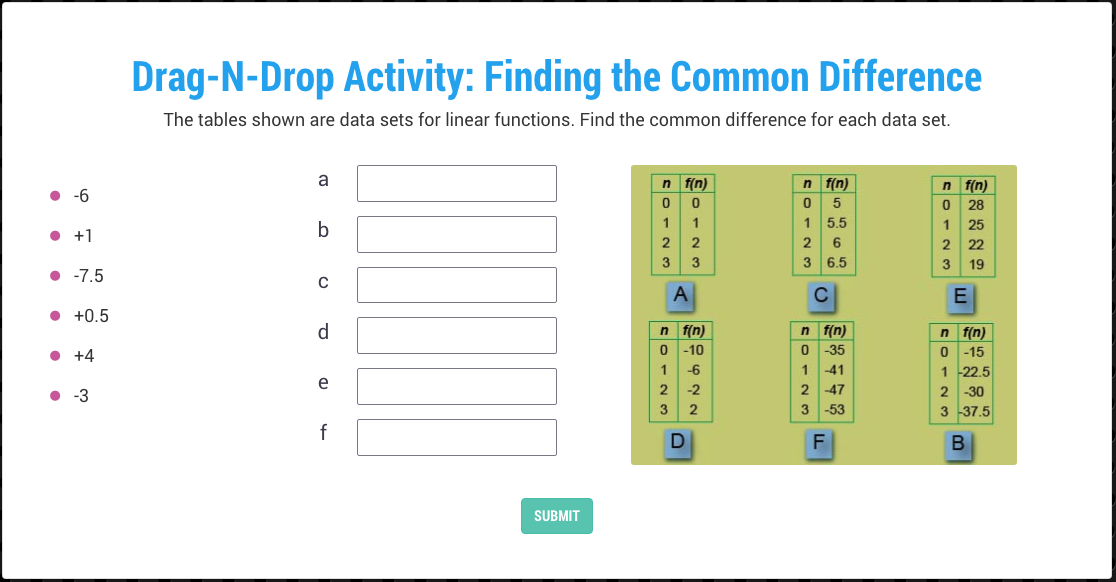
Students begin by analyzing linear function data by identifying the common difference. The goal is to see the relationship among the common difference and the slope of the linear function.
Students use the Desmos graphing calculator to explore graphs of data and equations. Both types of linear functions are explored:
- y = ax
- y = mx + b
Students then watch a video about the US mint and how currency is created. Students use the information in the video to develop two linear function models: one for calculating the number of bills produced for every sheet of printed bills, plus another for calculating the dollar value of the printed bills.
Note: Be sure students are familiar with the concept of slope and the basic definition of a function.
Math Concepts
- Functions
- Problem Solving
- Algebra
Learning Objectives
- The definition of a linear function
- How to graph linear functions
- How to display linear function data
- Mathematical modeling
Prerequisite Skills
- Slope formula
- Definition of a function
| Common Core Standards | CCSS.MATH.CONTENT.8.F.A.2, CCSS.MATH.CONTENT.8.F.A.3, CCSS.MATH.CONTENT.8.F.B.4 |
|---|---|
| Lesson Duration | 20 mins |
| Grade Range | 8th - 10th Grade |
Lesson Preview