Google Earth Voyager Story: The Geometry of Sustainable Architecture, Part 2
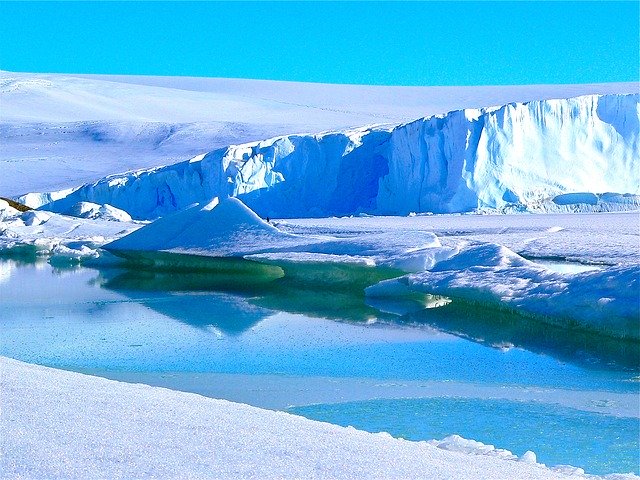
Architecture for the Antarctic needs to be built for warmth, but also to withstand the fierce blizzard conditions where snow accumulates quickly. There are a number of research stations in Antarctica and the for the purposes of research, scientists need to reside there for months at a time. In this exploration we look at Britain's Halley VI research station as a study in Antarctic architecture. To see the Google Earth version of this lesson go to this link (best viewed in Chrome).
To see the complete collection of Google Earth Voyager Stories from Media4Math, go to this link.
1. Introduction: The Basic Design of the Halley VI
To start this lesson, watch this video about the Halley VI research station.
Pause the video to see different views of the research station. Draw several diagrams to show what it looks like. What basic three-dimensional shapes is the Halley VI made up of?
2. Schematic view of Halley VI
Here is a cutaway view of one of the Halley VI modules.
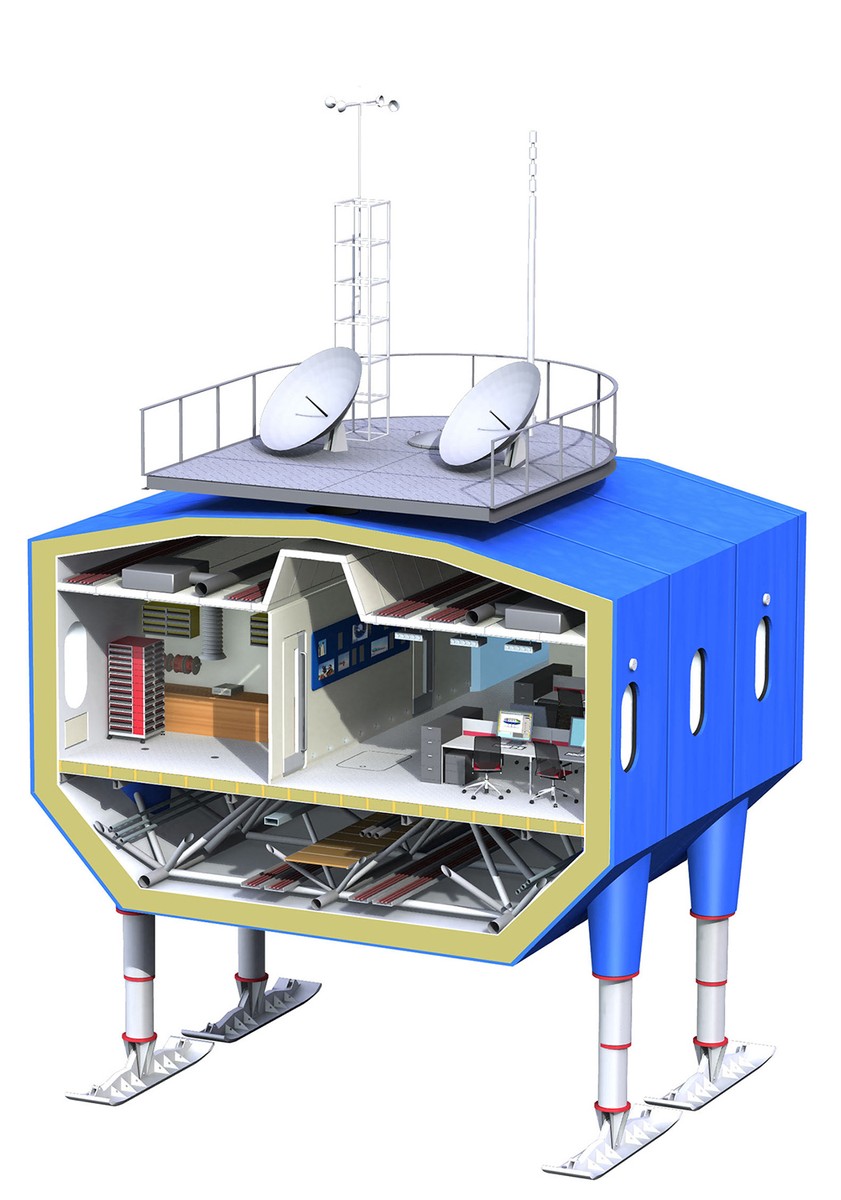
This three-dimensional shape is made up of rectangular and trapezoidal prisms, as shown in this animated sequence. Note the video shows a slightly simplified version of the structure, which we will analyze mathematically.
3. Mathematical Analysis
Let's start our analysis with the rectangular prism. This illustration shows the volume and surface area of a rectangular prism of width x and length and heights a multiple of x. The values of a and b are the multipliers.
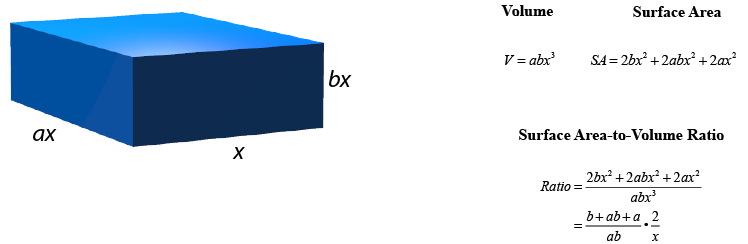
Click on this link to analyze this function on a Desmos graphing calculator. The graphing calculator window has values for a and b, the multipliers of x. Initially the values are equal. The x-axis is the width of the prism and the y-axis is the ratio of surface area to volume. The lower the y-value, the more heat is retained. Also, there is a value, w, for the actual width of the prism.
Test the following parameters:
- How does the size of the width affect the ratio? What does this say about the size of the prism?
- What happens to the ratio as you increase the size of a relative to b?
- At what point do changes in the value for a no longer decrease the ratio significantly?
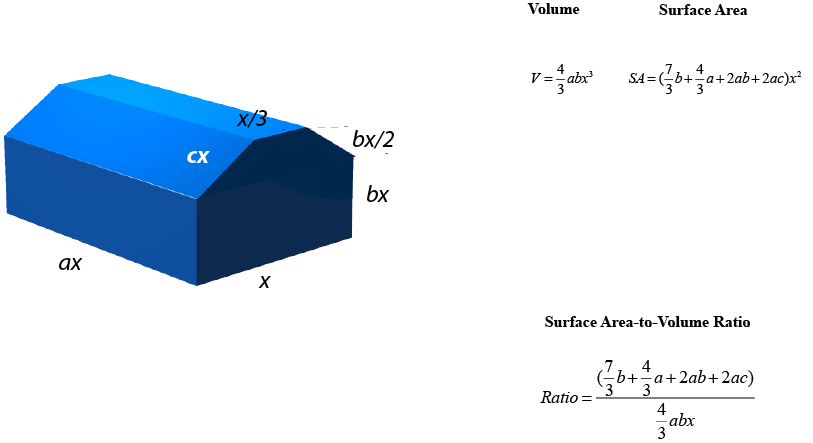
Now let's add a trapezoidal section to see the change in volume and surface area. Let's start by looking at the volume and surface area formulas for this trapezoidal piece.
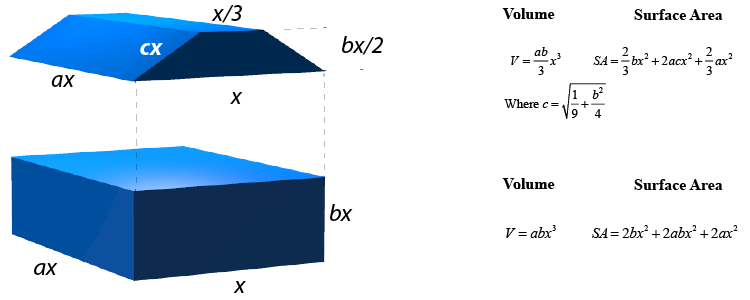
Next, let's look at the composite figure. You'll see that some of the surface area from the basic figure is hidden, so here are the adjusted volume and surface area formulas.
Click on this link to analyze the new function on a Desmos graphing calculator. The graphing calculator window has values for a, b, c, the multipliers of x. Initially the values of a and b are equal. The x-axis is the width of the prism and the y-axis is the ratio of surface area to volume. The lower the y-value, the more heat is retained. Also, there is a value, w, for the actual width of the prism. You'll see graphs of the original ratio and the new one.
Consider the following questions:
- How does the addition of the trapezoidal section affect the surface area to volume ratio?
- How would adding additional trapezoidal sections affect the ratio?
- How does the Halley VI's shape help to keep the structure warm?