These are the resources that support this Florida Standard.
MAFS.8.SP.1.4: Understand that patterns of association can also be seen in bivariate categorical data by displaying frequencies and relative frequencies in a two-way table. Construct and interpret a two-way table summarizing data on two categorical variables collected from the same subjects. Use relative frequencies calculated for rows or columns to describe possible association between the two variables. For example, collect data from students in your class on whether or not they have a curfew on school nights and whether or not they have assigned chores at home. Is there evidence that those who have a curfew also tend to have chores?
There are 24 resources.| Title | Description | Thumbnail Image | Curriculum Topics |
|---|---|---|---|
Halloween Math Collection |

|
3-Dimensional Figures, Applications of 3D Geometry, Numerical Expressions, Even and Odd Numbers, Ratios and Rates, Counting, Data Analysis and Divide by 1-Digit Numbers | |
Math in the News Collection: Applications of Data Analysis |

|
Data Analysis, Data Gathering, Probability, Percents and Ratios and Rates | |
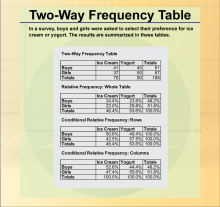
Math Clip Art Collection: Two-Way Frequency Tables |
|
Data Analysis | |
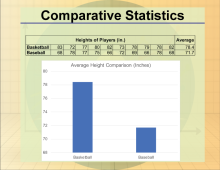
Math Clip Art Collection: Statistics |
Overview This colle |
|
Data Analysis, Probability, Data Gathering and Counting |
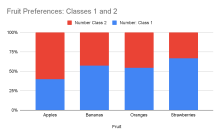
Instructional Resource--Segmented Bar Graphs |
Instructional Resource | Constructing a Segmented Bar GraphThis tutorial goes over the construction of a segmented bar graph, along with how it differs from other chart types. |
|
Data Analysis |
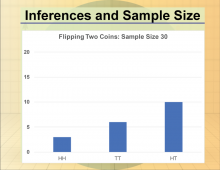
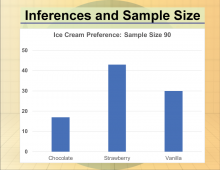
Math Clip Art--Statistics and Probability-- Inferences and Sample Size--10 |
Math Clip Art--Statistics and Probability-- Inferences and Sample Size--10This is part of a collection of math clip art images that show different statistical graphs and concepts, along with some probability concepts. |
|
Data Gathering |
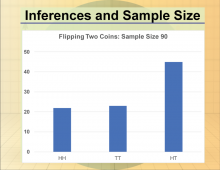
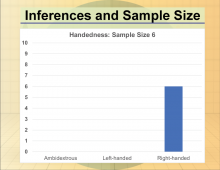
Math Clip Art--Statistics and Probability-- Inferences and Sample Size--11 |
Math Clip Art--Statistics and Probability-- Inferences and Sample Size--11This is part of a collection of math clip art images that show different statistical graphs and concepts, along with some probability concepts. |
|
Data Gathering |
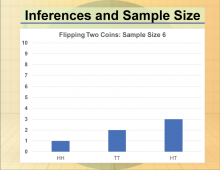
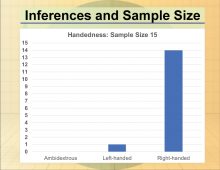
Math Clip Art--Statistics and Probability-- Inferences and Sample Size--12 |
Math Clip Art--Statistics and Probability-- Inferences and Sample Size--12This is part of a collection of math clip art images that show different statistical graphs and concepts, along with some probability concepts. |
|
Data Gathering |
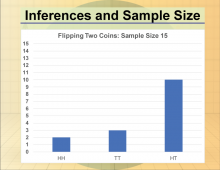
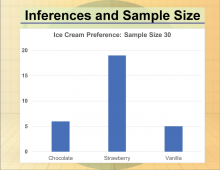
Math Clip Art--Statistics and Probability-- Inferences and Sample Size--9 |
Math Clip Art--Statistics and Probability-- Inferences and Sample Size--9This is part of a collection of math clip art images that show different statistical graphs and concepts, along with some probability concepts. |
|
Data Gathering |
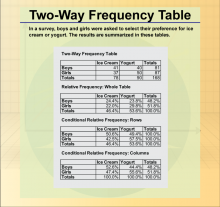
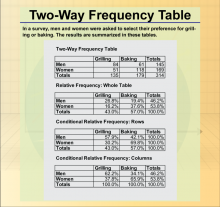
Math Clip Art--Statistics and Probability--Two-Way Frequency Table--1 |
Math Clip Art--Statistics and Probability--Two-Way Frequency Table--1This is part of a collection of math clip art images that show different statistical graphs and concepts, along with some probability concepts. |
|
Data Analysis |
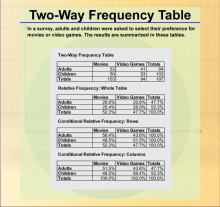
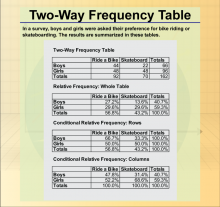
Math Clip Art--Statistics and Probability--Two-Way Frequency Table--2 |
Math Clip Art--Statistics and Probability--Two-Way Frequency Table--2This is part of a collection of math clip art images that show different statistical graphs and concepts, along with some probability concepts. |
|
Data Analysis |
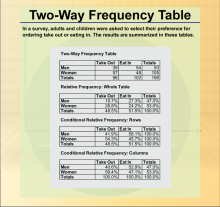
Math Clip Art--Statistics and Probability--Two-Way Frequency Table--3 |
Math Clip Art--Statistics and Probability--Two-Way Frequency Table--3This is part of a collection of math clip art images that show different statistical graphs and concepts, along with some probability concepts. |
|
Data Analysis |
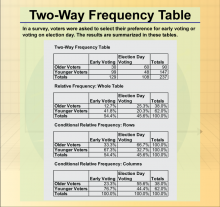
Math Clip Art--Statistics and Probability--Two-Way Frequency Table--4 |
Math Clip Art--Statistics and Probability--Two-Way Frequency Table--4This is part of a collection of math clip art images that show different statistical graphs and concepts, along with some probability concepts. |
|
Data Analysis |
Math Clip Art--Statistics and Probability--Two-Way Frequency Table--5 |
Math Clip Art--Statistics and Probability--Two-Way Frequency Table--5This is part of a collection of math clip art images that show different statistical graphs and concepts, along with some probability concepts. |
|
Data Analysis |
Math Clip Art--Statistics and Probability--Two-Way Frequency Table--6 |
Math Clip Art--Statistics and Probability--Two-Way Frequency Table--6This is part of a collection of math clip art images that show different statistical graphs and concepts, along with some probability concepts. |
|
Data Analysis |
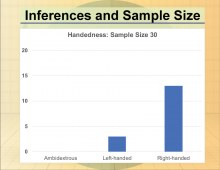
Math Clip Art--Statistics--Inferences and Sample Size--01 |
Math Clip Art--Statistics--Inferences and Sample Size--01This is part of a collection of math clip art images that show different statistical graphs and concepts, along with some probability concepts. |
|
Data Gathering |
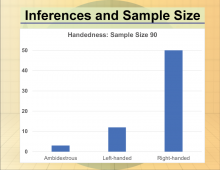
Math Clip Art--Statistics--Inferences and Sample Size--02 |
Math Clip Art--Statistics--Inferences and Sample Size--02This is part of a collection of math clip art images that show different statistical graphs and concepts, along with some probability concepts. |
|
Data Gathering |
Math Clip Art--Statistics--Inferences and Sample Size--03 |
Math Clip Art--Statistics--Inferences and Sample Size--03This is part of a collection of math clip art images that show different statistical graphs and concepts, along with some probability concepts. |
|
Data Gathering |
Math Clip Art--Statistics--Inferences and Sample Size--04 |
Math Clip Art--Statistics--Inferences and Sample Size--04This is part of a collection of math clip art images that show different statistical graphs and concepts, along with some probability concepts. |
|
Data Gathering |
Math Clip Art--Statistics--Inferences and Sample Size--05 |
Math Clip Art--Statistics--Inferences and Sample Size--05This is part of a collection of math clip art images that show different statistical graphs and concepts, along with some probability concepts. |
|
Data Gathering |
Math Clip Art--Statistics--Inferences and Sample Size--06 |
Math Clip Art--Statistics--Inferences and Sample Size--06This is part of a collection of math clip art images that show different statistical graphs and concepts, along with some probability concepts. |
|
Data Gathering |
Math Clip Art--Statistics--Inferences and Sample Size--07 |
Math Clip Art--Statistics--Inferences and Sample Size--07This is part of a collection of math clip art images that show different statistical graphs and concepts, along with some probability concepts. |
|
Data Gathering |
Math Clip Art--Statistics--Inferences and Sample Size--08 |
Math Clip Art--Statistics--Inferences and Sample Size--08This is part of a collection of math clip art images that show different statistical graphs and concepts, along with some probability concepts. |
|
Data Gathering |
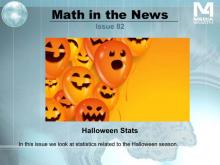
Math in the News: Issue 82--Halloween Stats |
Math in the News: Issue 82--Halloween StatsOctober 2013. In this issue we look at statistics related to Halloween 2013. We explore how the economy is affecting holiday spending. We also investigate why Halloween has grown in popularity over the years. |
|
Data Analysis |
Join the hundreds of thousands of math educators who have used Media4Math resources in their classroom to engage their students. Our new integrated Library/Classroom product has everything you need!
About Media4Math
Our Mission
Media4Math's mission is to educate 21st-century students in real-world applications of math with digital technology. We bring math to life in your classroom with a rich blend of resources to inspire your students to learn. Our philosophy is that the procedural side of math is a prerequisite to using it, but we also find that real-world math applications can provide motivation and even inspiration for math students. Math is its own language and it has important stories to tell. While many of our resources are for procedural skills, there are many resources that are real-world applications of math. Some of these resources rely on partnerships with other educational publishers.
About Media4Math Library
Media4Math Library contains over 15,000 high-quality resources designed for classroom or home use. This includes instructional, remediation, and assessment resources. You'll find truly innovative resources that bring math to life. Resources in Media4Math Library include:
- Videos
- Math Clip Art
- Math Examples
- Quizzes
- Tutorials
- PowerPoint and Google Slide presentations
- GoogleEarth Voyager Stories
- Algebra Applications
- Geometry Explorations
- Quizlet Flash Cards
- Desmos Resources
- Texas Instrument Resources
- Games and Simulations
About Media4Math Classroom
Media4Math Classroom provides ready-to-use interactive math lessons that teach, assess, and provide real-world applications of topics in Pre-Algebra, Algebra, and Geometry. Assign these modules to your students and capture assessment scores in an easy-to-use Dashboard. This is a growing library of instructional modules. Topics include:
- Arithmetic
- Pre-Algebra
- Algebra
- Geometry
- SAT Math Prep
Media4Math Classroom modules provide real world applications of math that will motivate your students. Here are some examples:
- Construction Site Math. Apply ratios and proportions to mixtures of cement and concrete. This module includes video resources and your students will get a real-world application of ratios and proportions.
- Counting Bison. Apply place value concepts to the real-world application of the bison population. Because the bison population has gone through dramatic changes in population, this become an opportunity to use and apply place value.
- Wildlife Refuge. This study of area and perimeter centers on the mustang population in the Nevada area. Students explore the relationship between area and perimeter of rectangular shapes in the context of designing a wildlife refuge.
The Media4Math Bundle
A subscription to the Media4Math bundle gives teachers access to all the resources listed above. Specifically:
- Access to all the Media4Math Library resources and tools.
- Access to all the Media4Math Classroom instructional modules.
To learn more about our subscription packages, contact us at admin@media4math.com.
Partnering with Media4Math
Media4Math prides itself on its strategic partnerships with other educational organizations. Our partnerships include the following partners:
-
Google Earth. Media4Math has partnered with GoogleEarth to create a comprehensive library of GoogleEarth Voyager Stories. These map-based explorations of geometry, geography, and culture will literally bring the math to life. See our collection of Voyager Stories by clicking on this link to the Google Earth resources.
-
Texas Instruments. TI is the leading provider of graphing calculators used in the classroom. Media4Math has partnered with TI to create a library of digital resources to support the use of these graphing calculators. These resources include videos, presentations, and related tutorials. See our collection of TI resources by clicking on this link to the TI resources.
-
Desmos. This free online resource that includes a graphing calculator and geometry tools. Media4Math has created an extensive library of resources that support the use of these Desmos resources. See our collection of Desmos resources by clicking on this link to the Desmos resources.
- Quizlet. We have partnered with the leading provider of interactive Flash Cards and is used by millions of teachers and students around the world. Media4Math has developed an extensive library of Quizlet resources. See our collection of Quizlet resources by clicking on this link to the Quizlet resources.
Link to the Media4Math Study Sets on Quizlet and search for "Media4Math."
- The Princeton Review. The Princeton Review is the leading provider of SAT prep and other test preparation courses and tutorials. Media4Math is an affiliate of Princeton Review and we have created a set of free SAT math resources, sponsored by Princeton Review. See this collection of SAT resources by clicking on this link to the Princeton Review resources.
If you would like to partner with Media4Math, please reach out to us at admin@media4math.com.