These are the resources that support this Florida Standard.
MAFS.912.S-ID.2.6: Represent data on two quantitative variables on a scatter plot, and describe how the variables are related.
a. Fit a function to the data; use functions fitted to data to solve problems in the context of the data. Use given functions or choose a function suggested by the context. Emphasize linear, and exponential models.
b. Informally assess the fit of a function by plotting and analyzing residuals.
c. Fit a linear function for a scatter plot that suggests a linear association.
There are 42 resources.
| Title | Description | Thumbnail Image | Curriculum Topics |
|---|---|---|---|
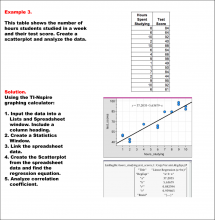
Math Example--Linear Function Concepts--Linear Data Model: Example 3 |
Math Example--Linear Function Concepts--Linear Data Model: Example 3This is part of a collection of math examples that focus on linear function concepts. |
|
Data Analysis |
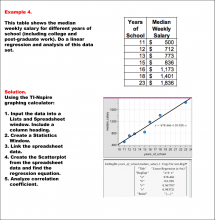
Math Example--Linear Function Concepts--Linear Data Model: Example 4 |
Math Example--Linear Function Concepts--Linear Data Model: Example 4This is part of a collection of math examples that focus on linear function concepts. |
|
Data Analysis |
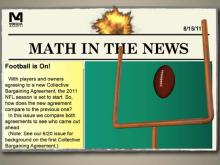
Math in the News: Issue 22--Football Is On! |
Math in the News: Issue 22--Football Is On!8/15/11. In this issue we look at the specifics of the new NFL collective bargaining agreement. It provides an opportunity to apply data analysis and algebra skills. |
|
Data Analysis |
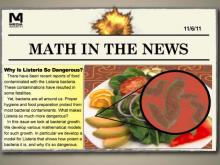
Math in the News: Issue 34--Why Is Listeria So Dangerous? |
Math in the News: Issue 34--Why Is Listeria So Dangerous?11/6/11. In this issue we look at the listeria bacteria to see what makes this particular type of bacteria so dangerous. |
|
Applications of Exponential and Logarithmic Functions |
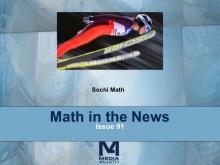
Math in the News: Issue 91--Sochi Math |
Math in the News: Issue 91--Sochi MathFebruary 2014. In this issue of Math in the News we look at applications of math from the Sochi Olympics. Specifically we look at ski jumping and develop a quadratic model based on given data. |
|
Applications of Quadratic Functions |
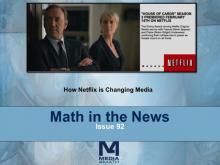
Math in the News: Issue 92--How Netflix Is Changing Media |
Math in the News: Issue 92--How Netflix Is Changing MediaFebruary 2014. In this issue of Math in the News we look at the dramatic growth in subscribers for Netflix. We calculate the rate of growth. We also explore how companies like Netflix are changing the viewing habits of all Americans. |
|
Applications of Exponential and Logarithmic Functions |
Video Transcript: TI-Nspire Mini-Tutorial: Graphing a Multiseries Scatterplot Using a Graphs and Geometry Window |
Video Transcript: TI-Nspire Mini-Tutorial: Graphing a Multiseries Scatterplot Using a Graphs and Geometry WindowThis is the transcript for the TI-Nspire Mini-Tutorial entitled, Graphing a Multiseries Scatterplot Using a Graphs and Geometry Window. |

|
Data Analysis |
Video Transcript: TI-Nspire Mini-Tutorial: Graphing a Scatterplot Using a Graphs and Geometry Window |
Video Transcript: TI-Nspire Mini-Tutorial: Graphing a Scatterplot Using a Graphs and Geometry WindowThis is the transcript for the TI-Nspire Mini-Tutorial entitled, Graphing a Scatterplot Using a Graphs and Geometry Window. |
|
Data Analysis |
Video Transcript: TI-Nspire Mini-Tutorial: Graphing a Scatterplot Using a Statistics Window |
Video Transcript: TI-Nspire Mini-Tutorial: Graphing a Scatterplot Using a Statistics WindowThis is the transcript for the TI-Nspire Mini-Tutorial entitled, Graphing a Scatterplot Using a Statistics Window. |
|
Data Analysis |
Video Tutorial: Line of Best Fit |
Video Tutorial: Line of Best FitThis video looks at the Line of Best Fit. A real-world data set is analyzed, from which a linear function in slope-intercept is derived. Students are shown how to find the line of best fit using a TI graphing calculator. Strategies for estimating the line of best fit are also explored. |

|
Slope-Intercept Form and Data Analysis |
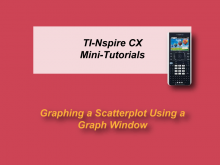
VIDEO: TI-Nspire CX Mini-Tutorial: Graphing a Scatterplot |
VIDEO: TI-Nspire CX Mini-Tutorial: Graphing a ScatterplotIn this TI-Nspire CX tutorial learn how graph data in a scatterplot using the graph window. |
|
Data Analysis |
VIDEO: Ti-Nspire Mini-Tutorial, Video 80 |
VIDEO: TI-Nspire Mini-Tutorial: Graphing a Multiseries Scatterplot Using a Graphs and Geometry WindowIn this TI Nspire tutorial, Spreadsheet and Graph windows are used to graph a multiseries scatterplot. This video supports the TI-Nspire Clickpad and Touchpad. |
|
Data Analysis |
VIDEO: Ti-Nspire Mini-Tutorial, Video 83 |
VIDEO: TI-Nspire Mini-Tutorial: Graphing a Scatterplot Using a Graphs and Geometry WindowIn this TI Nspire tutorial, Spreadsheet and Graph windows are used to graph a scatterplot. This video supports the TI-Nspire Clickpad and Touchpad. |
|
Data Analysis |
VIDEO: Ti-Nspire Mini-Tutorial, Video 84 |
VIDEO: TI-Nspire Mini-Tutorial: Graphing a Scatterplot Using a Statistics WindowIn this TI Nspire tutorial, Spreadsheet and Statistics windows are used to graph a scatterplot. This video supports the TI-Nspire Clickpad and Touchpad. |
|
Data Analysis |
Worksheet: TI-Nspire Mini-Tutorial: Graphing a Multiseries Scatterplot Using a Graphs and Geometry Window |
Worksheet: TI-Nspire Mini-Tutorial: Graphing a Multiseries Scatterplot Using a Graphs and Geometry WindowThis is part of a collection of math worksheets on the use of the TI-Nspire graphing calculator. Each worksheet supports a companion TI-Nspire Mini-Tutorial video. It provides all the keystrokes for the activity. |
|
Data Analysis |
Worksheet: TI-Nspire Mini-Tutorial: Graphing a Scatterplot Using a Graphs and Geometry Window |
Worksheet: TI-Nspire Mini-Tutorial: Graphing a Scatterplot Using a Graphs and Geometry WindowThis is part of a collection of math worksheets on the use of the TI-Nspire graphing calculator. Each worksheet supports a companion TI-Nspire Mini-Tutorial video. It provides all the keystrokes for the activity. |
|
Data Analysis |
Worksheet: TI-Nspire Mini-Tutorial: Graphing a Scatterplot Using a Statistics Window |
Worksheet: TI-Nspire Mini-Tutorial: Graphing a Scatterplot Using a Statistics WindowThis is part of a collection of math worksheets on the use of the TI-Nspire graphing calculator. Each worksheet supports a companion TI-Nspire Mini-Tutorial video. It provides all the keystrokes for the activity. |
|
Data Analysis |
Join the hundreds of thousands of math educators who have used Media4Math resources in their classroom to engage their students. Our new integrated Library/Classroom product has everything you need!
About Media4Math
Our Mission
Media4Math's mission is to educate 21st-century students in real-world applications of math with digital technology. We bring math to life in your classroom with a rich blend of resources to inspire your students to learn. Our philosophy is that the procedural side of math is a prerequisite to using it, but we also find that real-world math applications can provide motivation and even inspiration for math students. Math is its own language and it has important stories to tell. While many of our resources are for procedural skills, there are many resources that are real-world applications of math. Some of these resources rely on partnerships with other educational publishers.
About Media4Math Library
Media4Math Library contains over 15,000 high-quality resources designed for classroom or home use. This includes instructional, remediation, and assessment resources. You'll find truly innovative resources that bring math to life. Resources in Media4Math Library include:
- Videos
- Math Clip Art
- Math Examples
- Quizzes
- Tutorials
- PowerPoint and Google Slide presentations
- GoogleEarth Voyager Stories
- Algebra Applications
- Geometry Explorations
- Quizlet Flash Cards
- Desmos Resources
- Texas Instrument Resources
- Games and Simulations
About Media4Math Classroom
Media4Math Classroom provides ready-to-use interactive math lessons that teach, assess, and provide real-world applications of topics in Pre-Algebra, Algebra, and Geometry. Assign these modules to your students and capture assessment scores in an easy-to-use Dashboard. This is a growing library of instructional modules. Topics include:
- Arithmetic
- Pre-Algebra
- Algebra
- Geometry
- SAT Math Prep
Media4Math Classroom modules provide real world applications of math that will motivate your students. Here are some examples:
- Construction Site Math. Apply ratios and proportions to mixtures of cement and concrete. This module includes video resources and your students will get a real-world application of ratios and proportions.
- Counting Bison. Apply place value concepts to the real-world application of the bison population. Because the bison population has gone through dramatic changes in population, this become an opportunity to use and apply place value.
- Wildlife Refuge. This study of area and perimeter centers on the mustang population in the Nevada area. Students explore the relationship between area and perimeter of rectangular shapes in the context of designing a wildlife refuge.
The Media4Math Bundle
A subscription to the Media4Math bundle gives teachers access to all the resources listed above. Specifically:
- Access to all the Media4Math Library resources and tools.
- Access to all the Media4Math Classroom instructional modules.
To learn more about our subscription packages, contact us at admin@media4math.com.
Partnering with Media4Math
Media4Math prides itself on its strategic partnerships with other educational organizations. Our partnerships include the following partners:
-
Google Earth. Media4Math has partnered with GoogleEarth to create a comprehensive library of GoogleEarth Voyager Stories. These map-based explorations of geometry, geography, and culture will literally bring the math to life. See our collection of Voyager Stories by clicking on this link to the Google Earth resources.
-
Texas Instruments. TI is the leading provider of graphing calculators used in the classroom. Media4Math has partnered with TI to create a library of digital resources to support the use of these graphing calculators. These resources include videos, presentations, and related tutorials. See our collection of TI resources by clicking on this link to the TI resources.
-
Desmos. This free online resource that includes a graphing calculator and geometry tools. Media4Math has created an extensive library of resources that support the use of these Desmos resources. See our collection of Desmos resources by clicking on this link to the Desmos resources.
- Quizlet. We have partnered with the leading provider of interactive Flash Cards and is used by millions of teachers and students around the world. Media4Math has developed an extensive library of Quizlet resources. See our collection of Quizlet resources by clicking on this link to the Quizlet resources.
Link to the Media4Math Study Sets on Quizlet and search for "Media4Math."
- The Princeton Review. The Princeton Review is the leading provider of SAT prep and other test preparation courses and tutorials. Media4Math is an affiliate of Princeton Review and we have created a set of free SAT math resources, sponsored by Princeton Review. See this collection of SAT resources by clicking on this link to the Princeton Review resources.
If you would like to partner with Media4Math, please reach out to us at admin@media4math.com.