These are the resources that support this Florida Standard.
MA.7.DP.1.5 - Given a real-world numerical or categorical data set, choose and create an appropriate graphical representation.
Displaying 1 - 50 of 139 resources:
| Thumbnail Image | Title | Description | Curriculum Nodes |
|---|---|---|---|

|
Halloween Math Collection |
This is a collection of Halloween-themed math clip art and other resources. There are more than 40 resources. | 3-Dimensional Figures, Applications of 3D Geometry, Numerical Expressions, Even and Odd Numbers, Ratios and Rates, Counting, Data Analysis and Divide by 1-Digit Numbers |
|
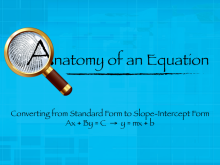
Interactive Media Collection: Linear Equations in Standards Form |
This collection aggregates all the math videos and other resources on the topic of Linear Equations in Standard Form. here are seven resources. | Standard Form |
|
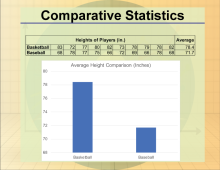
Math Clip Art Collection: Statistics |
This collection aggregates all the math clip art around the topic of Statistics. There are a total of 55 images. | Data Analysis, Probability, Data Gathering and Counting |
|
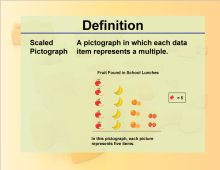
Math Definitions Collection: Charts and Graphs |
This collection aggregates all the definition image cards around the topic of Charts and Graphs. There are a total of 16 terms. | Data Analysis |
|
Math Games Collection: Drag-N-Drop |
This is a collection of all our drag-n-drop math games. There are a total of 34 games. | Addition Facts to 25, Counting, Subtraction Facts to 25, Place Value, Polynomial Expressions, Division Expressions and Equations, Point-Slope Form, Slope-Intercept Form, Standard Form, Slope, Applications of Linear Functions, Quadratic Equations and Functions, Data Analysis, Multiplication Expressions and Equations, Solving One-Step Equations, Quadratic Formula, Numerical Expressions, Variable Expressions and Solving Two-Step Equations |

|
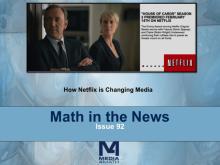
Math in the News Collection: Applications of Data Analysis |
This is a collection of Math in the News stories that focus on the topic of Data Analysis. | Data Analysis, Data Gathering, Probability, Percents and Ratios and Rates |
|
Math in the News Collection: Business Math |
This is a collection of issues of Math in the News that deal with business applications. | Applications of Exponential and Logarithmic Functions, Data Analysis and Volume |
|
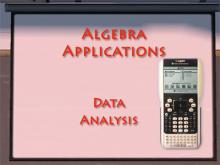
Math Video Collection: Algebra Applications Video Series: Data Analysis |
This collection aggregates all the math videos and resources in this series: Algebra Applications Video Series: Data Analysis. There are a total of 26 resources. | Data Analysis and Data Gathering |
|
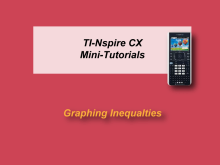
Math Video Collection: Texas Instruments Tutorial Videos |
This collection aggregates all the math videos and resources in this series: Texas Instruments Tutorial Videos. There are a total of 266 resources. | Rational Expressions, Sequences, Series, Polynomial Functions and Equations, Graphs of Quadratic Functions, Quadratic Equations and Functions, Solving Systems of Equations, Trig Expressions and Identities, Probability, Geometric Constructions with Triangles, Composite Functions, Geometric Constructions with Angles and Planes, Distance Formula, Data Analysis, Slope, Special Functions, Trigonometric Functions, Graphs of Exponential and Logarithmic Functions, Radical Functions and Equations, Rational Functions and Equations, Slope-Intercept Form, Coordinate Systems, Graphs of Linear Functions, Inequalities, Matrix Operations and Midpoint Formula |

|
Math Video Collection: Video Tutorials Series: Measures of Central Tendency |
This collection aggregates all the math videos and resources in this series: Video Tutorials Series: Measures of Central Tendency. There are a total of 24 resources. | Data Analysis and Data Gathering |
|
Closed Captioned Video: Algebra Applications: Data Analysis |
Closed Captioned Video: Algebra Applications: Data Analysis
In this episode of Algebra Applications, students explore the dramatic events of 2008 related to the mortgage crisis. |
Data Analysis and Data Gathering |

|
Closed Captioned Video: Algebra Applications: Data Analysis, 1 |
Closed Captioned Video: Algebra Applications: Data Analysis, Segment 1: Introduction
In this introductory segment students learn about the mortage crisis of 2008. |
Data Analysis and Data Gathering |

|
Closed Captioned Video: Algebra Applications: Data Analysis, 2 |
Closed Captioned Video: Algebra Applications: Data Analysis, Segment 2: What Is a Mortgage?
The time value of money is at the basis of all loans. |
Data Analysis and Data Gathering |
|
Closed Captioned Video: Algebra Applications: Data Analysis, 3 |
Closed Captioned Video: Algebra Applications: Data Analysis, Segment 3: What Is a What is a Subprime Mortgage?
Having learned the general features of a mortgage, students learn the specifics of a subprime mor |
Data Analysis and Data Gathering |
|
Closed Captioned Video: Algebra Applications: Data Analysis, 4 |
Closed Captioned Video: Algebra Applications: Data Analysis, Segment 4: What is an Adjustable Rate Mortgage?
Another factor in the mortgage crisis was the use of adjustable rate mortgages. |
Data Analysis and Data Gathering |
|
Closed Captioned Video: Algebra Nspirations: Data Analysis and Probability |
Closed Captioned Video: Algebra Nspirations: Data Analysis and Probability
What are the two meanings of statistics? What does it really mean that an event has a 50% probability of occurring? |
Data Analysis and Data Gathering |
|
Closed Captioned Video: Algebra Nspirations: Data Analysis and Probability, 1 |
Closed Captioned Video: Algebra Nspirations: Data Analysis and Probability, Segment 1
In this Investigation we explore uncertainty and randomness. |
Data Analysis and Data Gathering |
|
Closed Captioned Video: Algebra Nspirations: Data Analysis and Probability, 3 |
Closed Captioned Video: Algebra Nspirations: Data Analysis and Probability, Segment 3
In this Investigation we look at real-world data involving endangered wolf populations. |
Data Analysis and Data Gathering |
|
Closed Captioned Video: Measures of Central Tendency: Finding the Mode of a Data Set |
Closed Captioned Video: Measures of Central Tendency: Finding the Mode of a Data Set
In this video tutorial students learn how to calculate the mode of a data set, as well as how the mode differs from the mea |
Data Analysis and Data Gathering |
|
Closed Captioned Video: Random Number Table |
Closed Captioned Video: Random Number Table
In this TI Nspire tutorial, the Spreadsheet window is used to create a random number table. This video supports the TI-Nspire Clickpad and Touchpad. |
Probability |
|
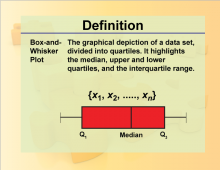
Definition--Charts and Graphs--Box-and-Whisker Plot |
Definition--Charts and Graphs--Box-and-Whisker Plot
This is a collection of definitions related to the concept of charts, graphs, and data displays. |
Data Analysis |
|
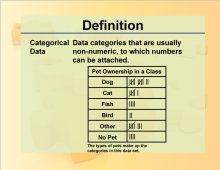
Definition--Charts and Graphs--Categorical Data |
Definition--Charts and Graphs--Categorical Data
This is a collection of definitions related to the concept of charts, graphs, and data displays. |
Data Analysis |
|
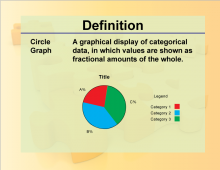
Definition--Charts and Graphs--Circle Graph |
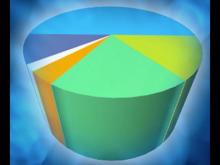
Definition--Charts and Graphs--Circle Graph
This is a collection of definitions related to the concept of charts, graphs, and data displays. |
Data Analysis |
|
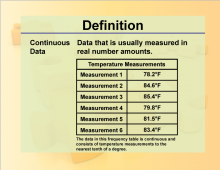
Definition--Charts and Graphs--Continuous Data |
Definition--Charts and Graphs--Continuous Data
This is a collection of definitions related to the concept of charts, graphs, and data displays. |
Data Analysis |
|
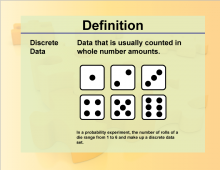
Definition--Charts and Graphs--Discrete Data |
Definition--Charts and Graphs--Discrete Data
This is a collection of definitions related to the concept of charts, graphs, and data displays. |
Data Analysis |
|
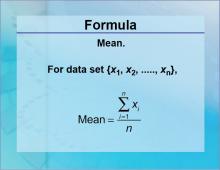
Formulas--Mean |
Formulas--Mean
The formula for the Mean. |
Data Analysis |
|
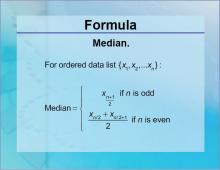
Formulas--Median |
Formulas--Median
The formula for the Median. |
Data Analysis |

|
HTML5 Interactive: Data Displays |
HTML5 Interactive: Data Displays
In this interactive, review seven commonly used data displays. Provides a quck review tool for a unit on data analysis. Note: the download is the Teacher's Guide. |
Data Gathering and Data Analysis |
|
|
HTML5 Interactive: Data Displays |
HTML5 Interactive: Data Displays
In this interactive, review seven commonly used data displays. Provides a quck review tool for a unit on data analysis. Note: the download is the Teacher's Guide. |
Data Gathering and Data Analysis |
|
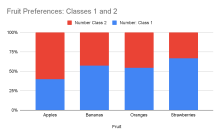
Instructional Resource--Segmented Bar Graphs |
Instructional Resource | Constructing a Segmented Bar Graph
This tutorial goes over the construction of a segmented bar graph, along with how it differs from other chart types. |
Data Analysis |

|
INSTRUCTIONAL RESOURCE: Nspire App Tutorial: Graphing a Scatterplot |
In this Slide Show, learn how graph data in a scatterplot using the graph window. This presentation requires the use of the TI-Nspire iPad App. Note: the download is a PPT. |
Graphs of Linear Functions, Slope-Intercept Form and Data Analysis |

|
Interactive Math Game--DragNDrop--Linear Functions |
Interactive Math Game--DragNDrop Math--Linear Functions
In this drag-and-drop game, match the linear function in slope-intercept form with its description. |
Applications of Linear Functions |
|
Interactive Math Game--DragNDrop--Linear Functions in Standard Form |
Interactive Math Game--DragNDrop Math--Linear Functions in Standard Form
In this drag-and-drop game, match the linear function in standard form with its slope-intercept counterpart. |
Standard Form |

|
Interactive Word Search Puzzle--Data Analysis, Puzzle 1 |
Interactive Word Search Puzzle--Data Analysis, Puzzle 1
Solve an interactive word search puzzle on the topic of Data Analysis. |
Data Analysis |

|
Interactive Word Search Puzzle--Data Analysis, Puzzle 2 |
Interactive Word Search Puzzle--Data Analysis, Puzzle 2
Solve an interactive word search puzzle on the topic of Data Analysis. |
Data Analysis |

|
Interactive Word Search Puzzle--Data Analysis, Puzzle 3 |
Interactive Word Search Puzzle--Data Analysis, Puzzle 3
Solve an interactive word search puzzle on the topic of Data Analysis. |
Data Analysis |

|
Interactive Word Search Puzzle--Data Analysis, Puzzle 4 |
Interactive Word Search Puzzle--Data Analysis, Puzzle 4
Solve an interactive word search puzzle on the topic of Data Analysis. |
Data Analysis |
|
Interactive Word Search Puzzle--Data Analysis, Puzzle 5 |
Interactive Word Search Puzzle--Data Analysis, Puzzle 5
Solve an interactive word search puzzle on the topic of Data Analysis. |
Data Analysis |
|
Math Clip Art--Statistics and Probability--Circle Graph |
Math Clip Art--Statistics and Probability--Circle Graph
This is part of a collection of math clip art images that show different statistical graphs and concepts, along with some probability concepts. |
Data Analysis |
|
Math Clip Art--Statistics--Bar Graph |
Math Clip Art--Statistics--Bar Graph
This is part of a collection of math clip art images that show different statistical graphs and concepts, along with some probability concepts. |
Data Analysis |
|
|
MATH EXAMPLES--The Mean |
MATH EXAMPLES--The Mean
This set of tutorials provides 42 examples of calculating the mean. NOTE: The download is a PPT file. |
Data Analysis |
|
|
MATH EXAMPLES--The Median |
MATH EXAMPLES--The Median
This set of tutorials provides 40 examples of calculating the median. NOTE: The download is a PPT file. |
Data Analysis |
|
|
MATH EXAMPLES--The Mode |
MATH EXAMPLES--The Mode
This set of tutorials provides 78 examples of calculating the mode. NOTE: The download is a PPT file. |
Data Analysis |
|
|
MATH EXAMPLES--The Range |
MATH EXAMPLES--The Range
This set of tutorials provides 26 examples of calculating the range. NOTE: The download is a PPT file. |
Data Analysis |

|
Math in the News: Issue 100--Late Night TV Ratings |
Math in the News: Issue 100--Late Night TV Ratings
July 2014. In this issue of Math in the News we look at the mathematics of the Nielsen Ratings. |
Data Analysis |
|
Math in the News: Issue 103--Gas Prices |
Math in the News: Issue 103--Gas Prices: Why Are They Decreasing?
December 2014. |
Data Analysis |
|
Math in the News: Issue 104--The Decline of Radio Shack |
Math in the News: Issue 104--The Decline of Radio Shack
December 2014. In this issue of Math in the News we analyze the reasons why Radio Shack has struggled as a business. |
Data Analysis |
|
Math in the News: Issue 105--Movie Statistics: 2014 |
Math in the News: Issue 105--Movie Statistics: 2014
January 2015. In this issue of Math in the News we review box office statistics for the previous year. |
Data Analysis |

|
Math in the News: Issue 109--Was Ali the Greatest? |
Math in the News: Issue 109--Was Ali the Greatest?
July 2016. In this issue of Math in the News we look at Muhammad Ali's boxing record and compare his record to other boxers. |
Data Analysis |
|
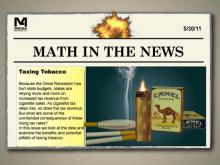
Math in the News: Issue 11--Taxing Tobacco |
Math in the News: Issue 11--Taxing Tobacco
5/30/11. In this issue we look at the subject of taxation of tobacco products. Many states are using such taxes to meet budget shortfalls. |
Data Analysis |