These are the resources that support this Florida Standard.
MA.8.DP.1.1 - Given a set of real-world bivariate numerical data, construct a scatter plot or a line graph as appropriate for the context.
Displaying 1 - 50 of 143 resources:
| Thumbnail Image | Title | Description | Curriculum Nodes |
|---|---|---|---|

|
Halloween Math Collection |
This is a collection of Halloween-themed math clip art and other resources. There are more than 40 resources. | 3-Dimensional Figures, Applications of 3D Geometry, Numerical Expressions, Even and Odd Numbers, Ratios and Rates, Counting, Data Analysis and Divide by 1-Digit Numbers |
|
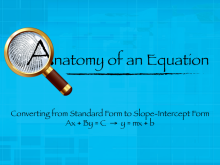
Interactive Media Collection: Linear Equations in Standards Form |
This collection aggregates all the math videos and other resources on the topic of Linear Equations in Standard Form. here are seven resources. | Standard Form |

|
Math Examples Collection: Analyzing Scatterplots |
This collection aggregates all the math examples around the topic of Analyzing Scatterplots. There are a total of 10 Math Examples. | Data Analysis |
|
Math Examples Collection: Charts, Graphs, and Plots |
This collection aggregates all the math examples around the topic of Charts, Graphs, and Plots. There are a total of 38 Math Examples. This collection of resources is made up of downloadable PNG images that you can easily incorporate into your lesson plans. | Slope-Intercept Form, Data Analysis, Point-Slope Form and Subtraction Facts to 100 |
|
Math Games Collection: Drag-N-Drop |
This is a collection of all our drag-n-drop math games. There are a total of 34 games. These games cover a variety of different skills. Each comes with a large bank of questions, so each game experience will be different. These games are ideal for practice and review. | Addition Facts to 25, Counting, Subtraction Facts to 25, Place Value, Polynomial Expressions, Division Expressions and Equations, Point-Slope Form, Slope-Intercept Form, Standard Form, Slope, Applications of Linear Functions, Quadratic Equations and Functions, Data Analysis, Multiplication Expressions and Equations, Solving One-Step Equations, Quadratic Formula, Numerical Expressions, Variable Expressions and Solving Two-Step Equations |

|
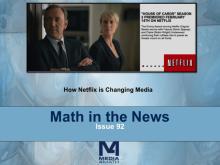
Math in the News Collection: Applications of Data Analysis |
This is a collection of Math in the News stories that focus on the topic of Data Analysis. | Data Analysis, Data Gathering, Probability, Percents and Ratios and Rates |
|
Math in the News Collection: Business Math |
This is a collection of issues of Math in the News that deal with business applications. | Applications of Exponential and Logarithmic Functions, Data Analysis and Volume |
|
Math Video Collection: Algebra Applications Video Series: Data Analysis |
This collection aggregates all the math videos and resources in this series: Algebra Applications Video Series: Data Analysis. There are a total of 26 resources. | Data Analysis and Data Gathering |

|
Math Video Collection: Video Tutorials Series: Measures of Central Tendency |
This collection aggregates all the math videos and resources in this series: Video Tutorials Series: Measures of Central Tendency. There are a total of 24 resources. | Data Analysis and Data Gathering |
|
Closed Captioned Video: Algebra Applications: Data Analysis |
Closed Captioned Video: Algebra Applications: Data Analysis
In this episode of Algebra Applications, students explore the dramatic events of 2008 related to the mortgage crisis. |
Data Analysis and Data Gathering |

|
Closed Captioned Video: Algebra Applications: Data Analysis, 1 |
Closed Captioned Video: Algebra Applications: Data Analysis, Segment 1: Introduction
In this introductory segment students learn about the mortage crisis of 2008. |
Data Analysis and Data Gathering |
|
Closed Captioned Video: Algebra Applications: Data Analysis, 2 |
Closed Captioned Video: Algebra Applications: Data Analysis, Segment 2: What Is a Mortgage?
The time value of money is at the basis of all loans. |
Data Analysis and Data Gathering |
|
Closed Captioned Video: Algebra Applications: Data Analysis, 3 |
Closed Captioned Video: Algebra Applications: Data Analysis, Segment 3: What Is a What is a Subprime Mortgage?
Having learned the general features of a mortgage, students learn the specifics of a subprime mor |
Data Analysis and Data Gathering |
|
Closed Captioned Video: Algebra Applications: Data Analysis, 4 |
Closed Captioned Video: Algebra Applications: Data Analysis, Segment 4: What is an Adjustable Rate Mortgage?
Another factor in the mortgage crisis was the use of adjustable rate mortgages. |
Data Analysis and Data Gathering |
|
Closed Captioned Video: Algebra Nspirations: Data Analysis and Probability |
Closed Captioned Video: Algebra Nspirations: Data Analysis and Probability
What are the two meanings of statistics? What does it really mean that an event has a 50% probability of occurring? |
Data Analysis and Data Gathering |
|
Closed Captioned Video: Algebra Nspirations: Data Analysis and Probability, 1 |
Closed Captioned Video: Algebra Nspirations: Data Analysis and Probability, Segment 1
In this Investigation we explore uncertainty and randomness. |
Data Analysis and Data Gathering |
|
Closed Captioned Video: Algebra Nspirations: Data Analysis and Probability, 3 |
Closed Captioned Video: Algebra Nspirations: Data Analysis and Probability, Segment 3
In this Investigation we look at real-world data involving endangered wolf populations. |
Data Analysis and Data Gathering |
|
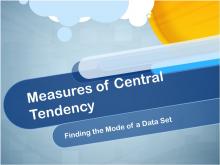
Closed Captioned Video: Measures of Central Tendency: Finding the Mode of a Data Set |
Closed Captioned Video: Measures of Central Tendency: Finding the Mode of a Data Set
In this video tutorial students learn how to calculate the mode of a data set, as well as how the mode differs from the mea |
Data Analysis and Data Gathering |
|
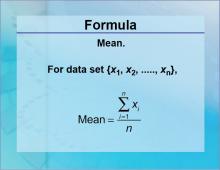
Formulas--Mean |
Formulas--Mean
The formula for the Mean. |
Data Analysis |
|
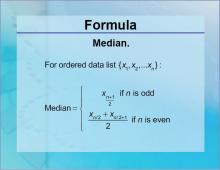
Formulas--Median |
Formulas--Median
The formula for the Median. |
Data Analysis |

|
HTML5 Interactive: Data Displays |
HTML5 Interactive: Data Displays
In this interactive, review seven commonly used data displays. Provides a quck review tool for a unit on data analysis. Note: the download is the Teacher's Guide. |
Data Gathering and Data Analysis |
|
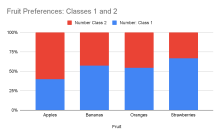
Instructional Resource--Segmented Bar Graphs |
Instructional Resource | Constructing a Segmented Bar Graph
This tutorial goes over the construction of a segmented bar graph, along with how it differs from other chart types. |
Data Analysis |

|
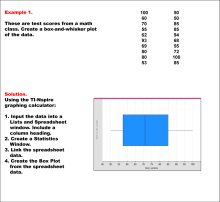
INSTRUCTIONAL RESOURCE: Nspire App Tutorial: Graphing a Scatterplot |
In this Slide Show, learn how graph data in a scatterplot using the graph window. This presentation requires the use of the TI-Nspire iPad App. Note: the download is a PPT. |
Graphs of Linear Functions, Slope-Intercept Form and Data Analysis |

|
Interactive Math Game--DragNDrop--Linear Functions |
Interactive Math Game--DragNDrop Math--Linear Functions
In this drag-and-drop game, match the linear function in slope-intercept form with its description. |
Applications of Linear Functions |
|
Interactive Math Game--DragNDrop--Linear Functions in Standard Form |
Interactive Math Game--DragNDrop Math--Linear Functions in Standard Form
In this drag-and-drop game, match the linear function in standard form with its slope-intercept counterpart. |
Standard Form |

|
Interactive Word Search Puzzle--Data Analysis, Puzzle 1 |
Interactive Word Search Puzzle--Data Analysis, Puzzle 1
Solve an interactive word search puzzle on the topic of Data Analysis. |
Data Analysis |

|
Interactive Word Search Puzzle--Data Analysis, Puzzle 2 |
Interactive Word Search Puzzle--Data Analysis, Puzzle 2
Solve an interactive word search puzzle on the topic of Data Analysis. |
Data Analysis |

|
Interactive Word Search Puzzle--Data Analysis, Puzzle 3 |
Interactive Word Search Puzzle--Data Analysis, Puzzle 3
Solve an interactive word search puzzle on the topic of Data Analysis. |
Data Analysis |

|
Interactive Word Search Puzzle--Data Analysis, Puzzle 4 |
Interactive Word Search Puzzle--Data Analysis, Puzzle 4
Solve an interactive word search puzzle on the topic of Data Analysis. |
Data Analysis |
|
Interactive Word Search Puzzle--Data Analysis, Puzzle 5 |
Interactive Word Search Puzzle--Data Analysis, Puzzle 5
Solve an interactive word search puzzle on the topic of Data Analysis. |
Data Analysis |
|
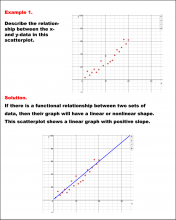
Math Example--Charts, Graphs, and Plots--Analyzing Scatterplots: Example 1 |
Math Example--Charts, Graphs, and Plots-- Analyzing Scatterplots: Example 1
In this set of math examples, analyze the behavior of different scatterplots. This includes linear and quadratic models. |
Data Analysis |
|
Math Example--Charts, Graphs, and Plots--Analyzing Scatterplots: Example 10 |
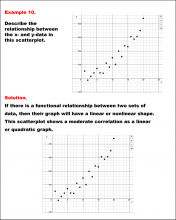
Math Example--Charts, Graphs, and Plots-- Analyzing Scatterplots: Example 10
In this set of math examples, analyze the behavior of different scatterplots. This includes linear and quadratic models. |
Data Analysis |
|
Math Example--Charts, Graphs, and Plots--Analyzing Scatterplots: Example 2 |
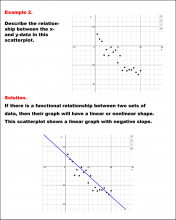
Math Example--Charts, Graphs, and Plots-- Analyzing Scatterplots: Example 2
In this set of math examples, analyze the behavior of different scatterplots. This includes linear and quadratic models. |
Data Analysis |

|
Math Example--Charts, Graphs, and Plots--Analyzing Scatterplots: Example 3 |
Math Example--Charts, Graphs, and Plots-- Analyzing Scatterplots: Example 3
In this set of math examples, analyze the behavior of different scatterplots. This includes linear and quadratic models. |
Data Analysis |
|
Math Example--Charts, Graphs, and Plots--Analyzing Scatterplots: Example 4 |
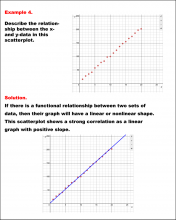
Math Example--Charts, Graphs, and Plots-- Analyzing Scatterplots: Example 4
In this set of math examples, analyze the behavior of different scatterplots. This includes linear and quadratic models. |
Data Analysis |
|
Math Example--Charts, Graphs, and Plots--Analyzing Scatterplots: Example 5 |
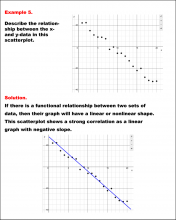
Math Example--Charts, Graphs, and Plots-- Analyzing Scatterplots: Example 5
In this set of math examples, analyze the behavior of different scatterplots. This includes linear and quadratic models. |
Data Analysis |
|
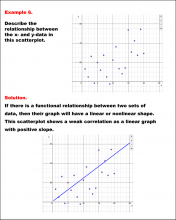
Math Example--Charts, Graphs, and Plots--Analyzing Scatterplots: Example 6 |
Math Example--Charts, Graphs, and Plots-- Analyzing Scatterplots: Example 6
In this set of math examples, analyze the behavior of different scatterplots. This includes linear and quadratic models. |
Data Analysis |
|
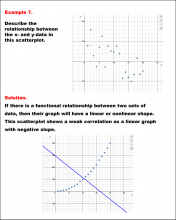
Math Example--Charts, Graphs, and Plots--Analyzing Scatterplots: Example 7 |
Math Example--Charts, Graphs, and Plots-- Analyzing Scatterplots: Example 7
In this set of math examples, analyze the behavior of different scatterplots. This includes linear and quadratic models. |
Data Analysis |
|
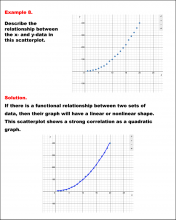
Math Example--Charts, Graphs, and Plots--Analyzing Scatterplots: Example 8 |
Math Example--Charts, Graphs, and Plots-- Analyzing Scatterplots: Example 8
In this set of math examples, analyze the behavior of different scatterplots. This includes linear and quadratic models. |
Data Analysis |
|
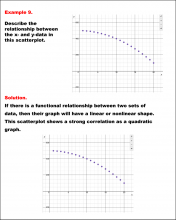
Math Example--Charts, Graphs, and Plots--Analyzing Scatterplots: Example 9 |
Math Example--Charts, Graphs, and Plots-- Analyzing Scatterplots: Example 9
In this set of math examples, analyze the behavior of different scatterplots. This includes linear and quadratic models. |
Data Analysis |
|
Math Example--Charts, Graphs, and Plots--Estimating the Line of Best Fit: Example 1 |
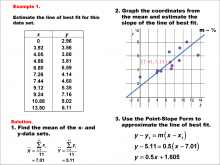
Math Example--Charts, Graphs, and Plots-- Estimating the Line of Best Fit: Example 1
In this set of math examples, analyze the behavior of different scatterplots. |
Slope-Intercept Form and Data Analysis |
|
Math Example--Charts, Graphs, and Plots--Estimating the Line of Best Fit: Example 2 |
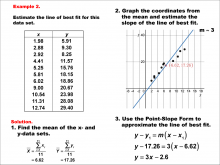
Math Example--Charts, Graphs, and Plots-- Estimating the Line of Best Fit: Example 2
In this set of math examples, analyze the behavior of different scatterplots. |
Point-Slope Form, Slope-Intercept Form and Data Analysis |
|
Math Example--Charts, Graphs, and Plots--Estimating the Line of Best Fit: Example 3 |
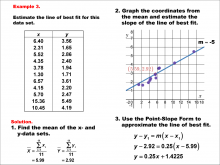
Math Example--Charts, Graphs, and Plots-- Estimating the Line of Best Fit: Example 3
In this set of math examples, analyze the behavior of different scatterplots. |
Point-Slope Form, Slope-Intercept Form and Data Analysis |
|
Math Example--Charts, Graphs, and Plots--Estimating the Line of Best Fit: Example 4 |
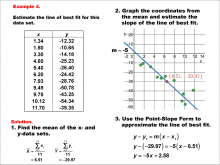
Math Example--Charts, Graphs, and Plots-- Estimating the Line of Best Fit: Example 4
In this set of math examples, analyze the behavior of different scatterplots. |
Point-Slope Form, Slope-Intercept Form and Data Analysis |
|
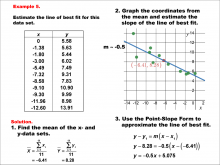
Math Example--Charts, Graphs, and Plots--Estimating the Line of Best Fit: Example 5 |
Math Example--Charts, Graphs, and Plots-- Estimating the Line of Best Fit: Example 5
In this set of math examples, analyze the behavior of different scatterplots. |
Point-Slope Form, Slope-Intercept Form and Data Analysis |
|
|
MATH EXAMPLES--The Mean |
MATH EXAMPLES--The Mean
This set of tutorials provides 42 examples of calculating the mean. NOTE: The download is a PPT file. |
Data Analysis |
|
|
MATH EXAMPLES--The Median |
MATH EXAMPLES--The Median
This set of tutorials provides 40 examples of calculating the median. NOTE: The download is a PPT file. |
Data Analysis |
|
|
MATH EXAMPLES--The Mode |
MATH EXAMPLES--The Mode
This set of tutorials provides 78 examples of calculating the mode. NOTE: The download is a PPT file. |
Data Analysis |
|
|
MATH EXAMPLES--The Range |
MATH EXAMPLES--The Range
This set of tutorials provides 26 examples of calculating the range. NOTE: The download is a PPT file. |
Data Analysis |

|
Math in the News: Issue 100--Late Night TV Ratings |
Math in the News: Issue 100--Late Night TV Ratings
July 2014. In this issue of Math in the News we look at the mathematics of the Nielsen Ratings. |
Data Analysis |