These are the resources that support this Florida Standard.
MA.912.DP.2.2 - Use the mean and standard deviation of a data set to fit it to a normal distribution and to estimate population percentages. Recognize that there are data sets for which such a procedure is not appropriate.
Displaying 1 - 11 of 11 resources:
| Thumbnail Image | Title | Description | Curriculum Nodes |
|---|---|---|---|
|
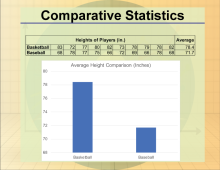
Math Clip Art Collection: Statistics |
This collection aggregates all the math clip art around the topic of Statistics. There are a total of 55 images. | Data Analysis, Probability, Data Gathering and Counting |
|
Math Definitions Collection: Measures of Central Tendency |
This collection aggregates all the definition image cards around the topic of Measures of Central Tendency terms and vocabulary. There are a total of 31 terms. | Data Analysis |
|
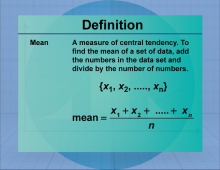
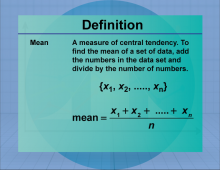
Definition--Measures of Central Tendency--Mean |
Definition--Measures of Central Tendency--Mean
This is a collection of definitions related to measures of central tendency and related concepts. |
Data Analysis |
|
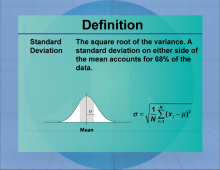
Definition--Measures of Central Tendency--Standard Deviation |
Definition--Measures of Central Tendency--Standard Deviation
This is a collection of definitions related to measures of central tendency and related concepts. |
Data Analysis |
|
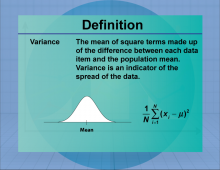
Definition--Measures of Central Tendency--Variance |
Definition--Measures of Central Tendency--Variance
This is a collection of definitions related to measures of central tendency and related concepts. |
Data Analysis |
|
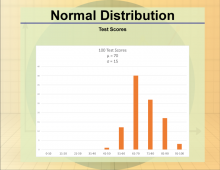
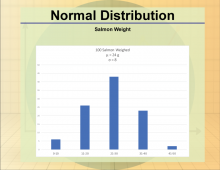
Math Clip Art--Statistics--Normal Distribution--01 |
Math Clip Art--Statistics--Normal Distribution--01
This is part of a collection of math clip art images that show different statistical graphs and concepts, along with some probability concepts. |
Probability |
|
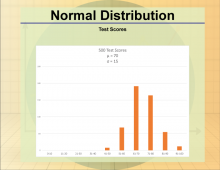
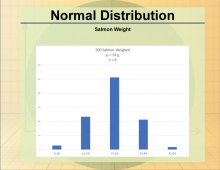
Math Clip Art--Statistics--Normal Distribution--02 |
Math Clip Art--Statistics--Normal Distribution--02
This is part of a collection of math clip art images that show different statistical graphs and concepts, along with some probability concepts. |
Probability |
|
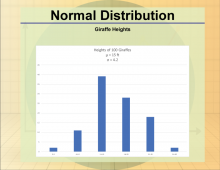
Math Clip Art--Statistics--Normal Distribution--03 |
Math Clip Art--Statistics--Normal Distribution--03
This is part of a collection of math clip art images that show different statistical graphs and concepts, along with some probability concepts. |
Probability |
|
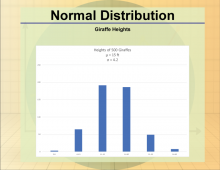
Math Clip Art--Statistics--Normal Distribution--04 |
Math Clip Art--Statistics--Normal Distribution--04
This is part of a collection of math clip art images that show different statistical graphs and concepts, along with some probability concepts. |
Probability |
|
Math Clip Art--Statistics--Normal Distribution--05 |
Math Clip Art--Statistics--Normal Distribution--05
This is part of a collection of math clip art images that show different statistical graphs and concepts, along with some probability concepts. |
Probability |
|
Math Clip Art--Statistics--Normal Distribution--06 |
Math Clip Art--Statistics--Normal Distribution--06
This is part of a collection of math clip art images that show different statistical graphs and concepts, along with some probability concepts. |
Probability |