Probability and Playing Cards: Card Groups
You know that a deck of playing cards consists of 52 unique cards.
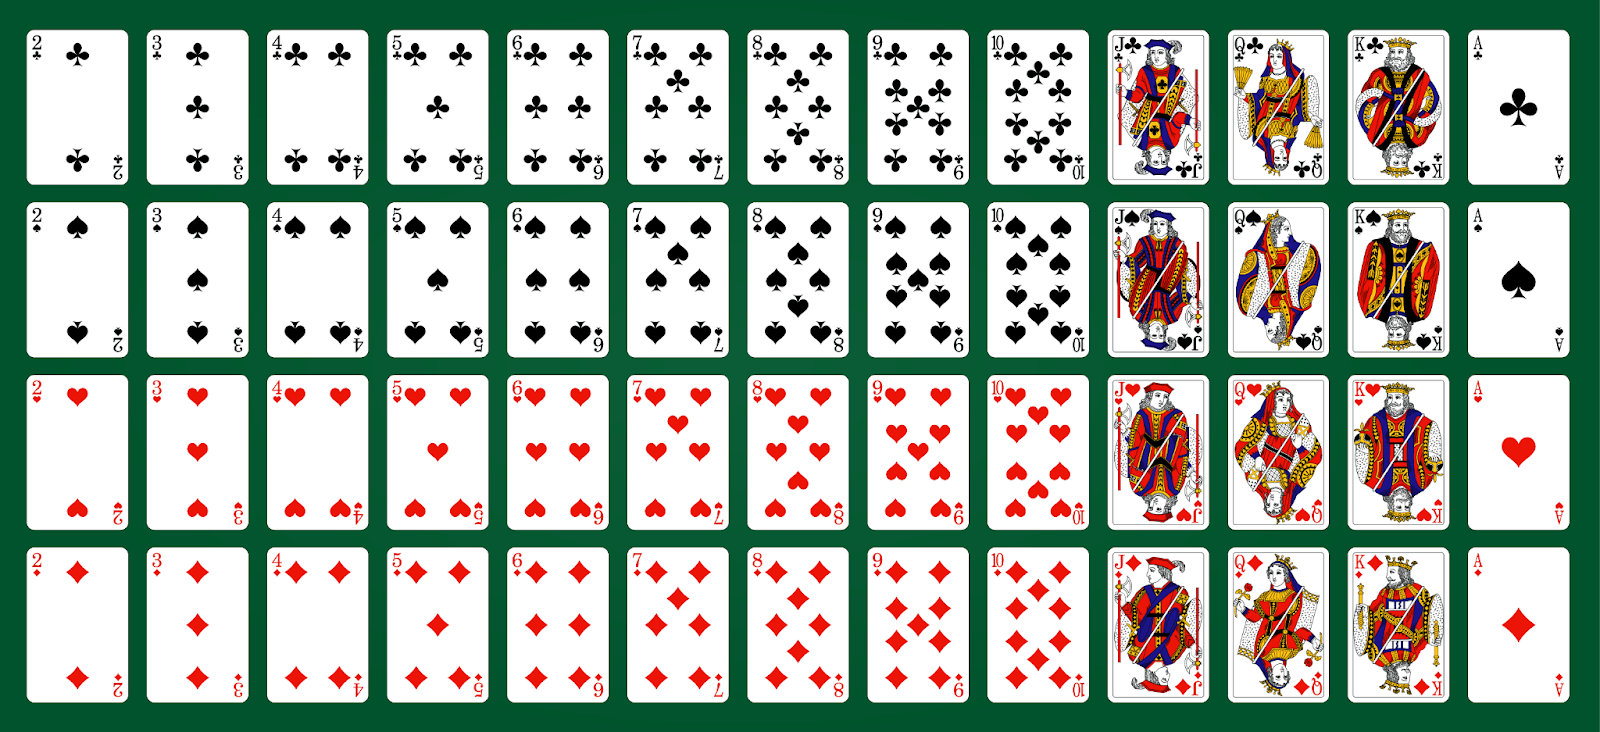
If you have a deck of 52 playing cards and randomly select a card, the probability of selecting a specific card is shown below:

This probability takes into account that each card is unique. The probability calculated is for an independent event.
But cards are also parts of groups. In this lesson we'll look at calculating probabilities based on different groupings.
Card Groups
Card Color. The first group to analyze is the simplest. Notice that the cards in the deck come in two colors: red and black. Half the deck is red and half is black.

Here is the card deck simulation. In this simulation each instance of a New Card is based on the 52 unique cards. It's the same as selecting a card at random and then putting the card back in the deck. This ensures that there are always 52 cards in the deck.
If you click on New Card, you will see a card randomly generated. Try it a few times. Then click on Reset to start again.
In this simulation each instance of a New Card is based on the 52 unique cards. It's the same as selecting a card at random and then putting the card back in the deck. This ensures that there are always 52 cards in the deck.
Activity 1
Run a simulation of selecting 50 cards and validate the probability of a red or black card is 50%.
Follow these directions:
- Click on New Card 100 times. The Counter will keep track of the number of cards you have flipped.
- Make a note of the number of times the card came up red and the number of times it came up black.
- Fill out a table like the one below:
|
|
|
|
|
Analysis
How many times did you see red cards? How many times did you see black cards? Repeat the activity and compare your results to the first instance.
Activity 2
Number Groups. Another card grouping involves the card numbers. For example, there are four cards labeled 2, 3, etc. The same goes for the face cards (Jack, Queen, and King) and the Aces.
So what is the probability of randomly selecting one of these cards?


Run a simulation of selecting 100 cards and check how many times you drew an Ace.
Follow these directions:
- Click on Reset to start a new simulation.
- Click on New Card 100 times. The Counter will keep track of the number of cards you have flipped.
- Make a note of the number of times the card came up as an Ace.
Analysis
How many times did you see an Ace? How does this align with the theoretical probability? Repeat the activity and compare your results to the first instance.
Activity 3
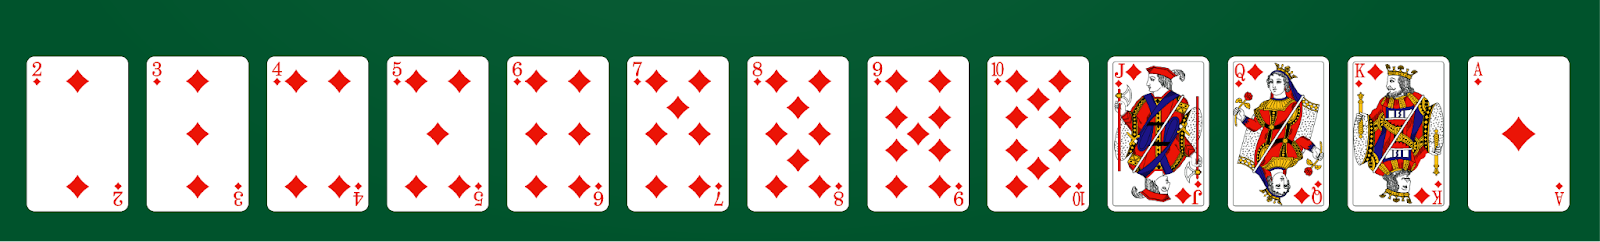
Suit Groups. Another card grouping involves the suit of the cards. There are four suits: spades, heart, diamonds, and clubs. There are 13 of each type of suit. So, the probability of getting a card of a specific suit is shown below:

Run a simulation of selecting 100 cards and check how many times you get a diamond.
Follow these directions:
- Click on Reset to start a new simulation.
- Click on New Card 100 times. The Counter will keep track of the number of cards you have flipped.
- Make a note of the number of times the cards came up as diamonds.
Analysis
How many times did you see diamonds ? How does this align with the theoretical probability? Repeat the activity and compare your results to the first instance.
Activity 4: Probabilities Involving AND
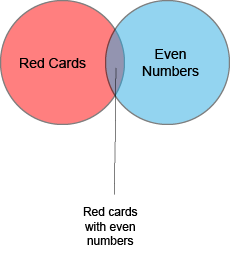
Mixed Groups. You can also create an intersection of two groups and find the probabilities for cards in that group. For example, suppose you want to know the probability of drawing a red card with an even number. This involves the intersection of two different groups, as shown in the Venn diagram.
You can also see the cards in this illustration.
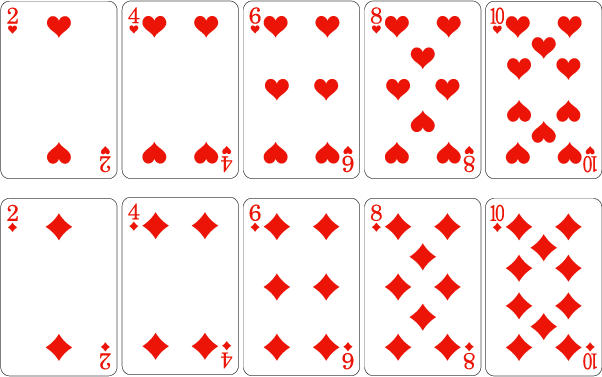
There are a total of 10 such cards and we use the symbol shown in the formula to indicate the intersection of two different sets. Here’s how to write and calculate the probability.

Run a simulation of selecting 100 cards and check how many times you get a red card with an even number.
Follow these directions:
- Click on Reset to start a new simulation.
- Click on New Card 100 times. The Counter will keep track of the number of cards you have flipped.
- Make a note of the number of times the cards came up as a red card with an even number on it.
Analysis
How many times did you see a red card with an even number on it? How does this align with the theoretical probability? Repeat the activity and compare your results to the first instance.
Activity 5: Probabilities Involving OR
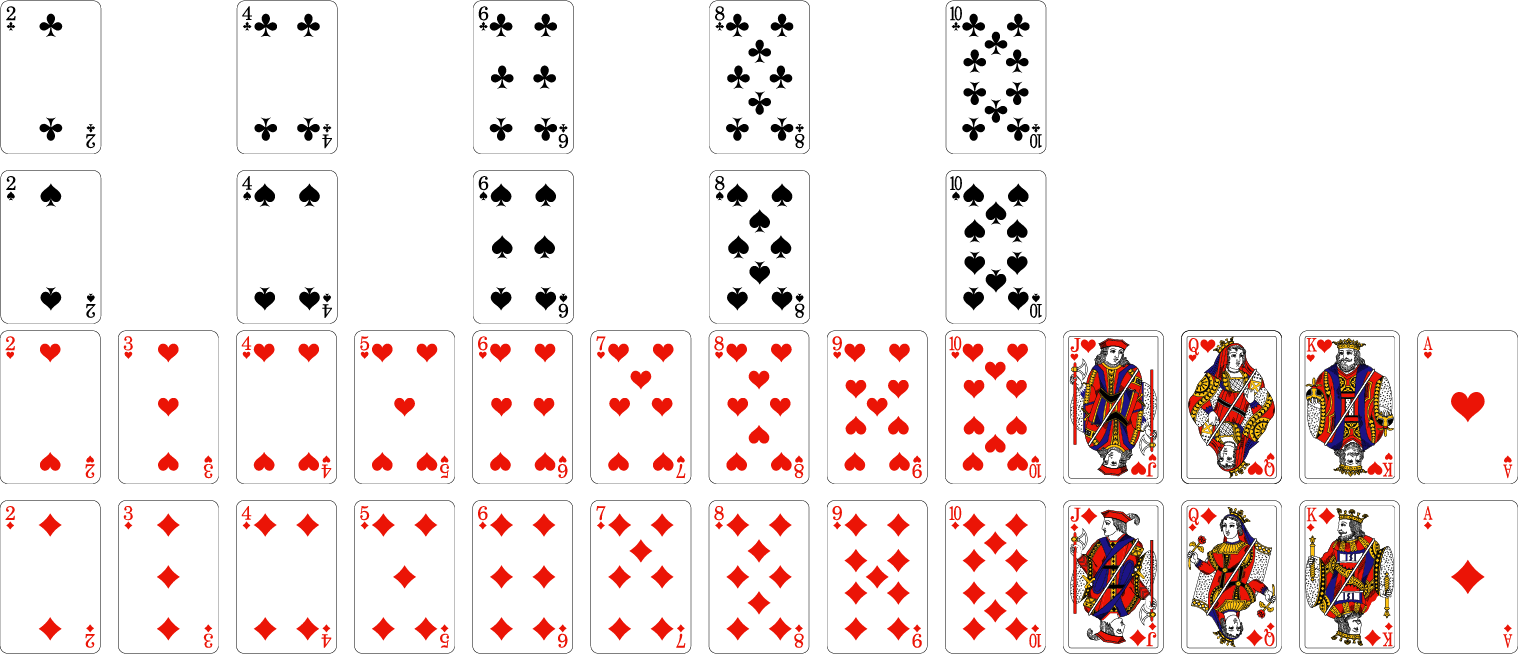
Inclusive Groups. You can also create a group that includes the members of subgroups. For example, suppose you want to know the probability of drawing a red card OR a card with an even number. This involves the combination of two different groups, as shown in the Venn diagram.
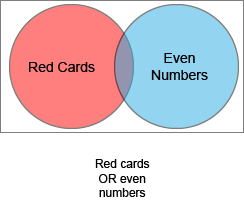
These are the cards that are either red OR even. There are a total of 34 cards. The illustration shows the union of the two circles in the Venn diagram.
Here’s how to write and calculate the probability.

Run a simulation of selecting 100 cards and check how many times you get a red card with an even number.
Follow these directions:
- Click on Reset to start a new simulation.
- Click on New Card 100 times. The Counter will keep track of the number of cards you have flipped.
- Make a note of the number of times the cards came up as a red card OR an even number on it.
Analysis
How many times did you see a red card or an even number on it? How does this align with the theoretical probability? Repeat the activity and compare your results to the first instance.