 Lesson Plan: Linear Inequalities
Lesson Summary
This lesson introduces middle school students to linear inequalities, focusing on understanding, graphing, and solving them algebraically. Students will learn to interpret inequality symbols, represent solution sets graphically, and apply linear inequalities to real-world scenarios. The lesson aligns with Common Core Standards 6.NS.C.7a, 6.EE.B.5, 8.EE.B.5, and 8.EE.C.7b.
Lesson Objectives
- Understand the concept of linear inequalities
- Graph linear inequalities on the coordinate plane
- Solve linear inequalities algebraically
- Interpret and apply linear inequalities in real-world situations
Common Core Standards
- 6.NS.C.7a: Interpret statements of inequality as statements about the relative position of two numbers on a number line diagram.
- 6.EE.B.5: Understand solving an equation or inequality as a process of answering a question: which values from a specified set, if any, make the equation or inequality true? Use substitution to determine whether a given number in a specified set makes an equation or inequality true.
- 8.EE.B.5: Graph proportional relationships, interpreting the unit rate as the slope of the graph.
- 8.EE.C.7b: Solve linear equations with rational number coefficients, including equations whose solutions require expanding expressions using the distributive property and collecting like terms.
Prerequisite Skills
- Understanding of linear equations
- Graphing linear equations
- Solving linear equations algebraically
Key Vocabulary
- Linear Inequality: An inequality that involves a linear expression in one or two variables, such as \(2x + 3 \leq 7\).
- Solution Set: The set of all values that satisfy the inequality.
- Inequality Symbols: Symbols that denote the relationship between expressions:
- \(<\): Less than
- \(>\): Greater than
- \(\leq\): Less than or equal to
- \(\geq\): Greater than or equal to
- Boundary Line: In graphing, the line that represents the equation part of a linear inequality. It divides the coordinate plane into regions and helps determine which region satisfies the inequality.
Multimedia Resources
- Math definitions of terms related to linear equations and functions: https://www.media4math.com/Definitions--LinearFunctions
- Video definitions on the topic of linear equations and functions: https://www.media4math.com/MathVideoCollection--LinearFunctionsDefinitions
Warm Up Activities
Use one or more of these activities
Activity 1: Review of Inequalities
Introduce the concept of inequalities by asking students to compare two quantities using inequality symbols (e.g., 5 < 7, 10 ≥ 8). Discuss how inequalities are different from equations and how they represent a range of values rather than a single value.
Use this slide show to go over math examples of inequalities in one variable graphed on a number line:
https://www.media4math.com/library/slideshow/math-examples-one-variable-inequalities
Activity 2: Equation Models – Exploring Unbalanced Equations and Inequalities
Before solving linear inequalities, students will explore how inequalities represent unbalanced situations. Using physical models (such as balance scales) or interactive online tools, students will analyze different inequality statements.
- Provide students with simple balance problems, such as:
- \( 4 + x = 7 \) (Balanced)
- \( 3x + 2 > 11 \) (Unbalanced – explore solutions for \( x \))
- Have students use algebra tiles or an online balance scale simulator (e.g., Math Playground Balance Scale) to model these equations and inequalities.
- Discuss how adding, subtracting, multiplying, or dividing each side maintains or changes the inequality.
Activity 3: Desmos – Simple Graphs of Linear Inequalities
Students will use the Desmos Graphing Calculator to visualize simple inequalities.
- Go to Desmos Graphing Calculator.
- Have students enter and analyze inequalities like:
- \( y > 3 \) (Graph should shade above the horizontal line \( y = 3 \)).
- \( x < -2 \) (Graph should shade left of the vertical line \( x = -2 \)).
- Discuss how shaded regions represent solution sets and whether the boundary line should be solid (\(\leq, \geq\)) or dashed (\(<, >\)).
Activity 4: Video Exploration
Show this video, which is a real-world application of inequalities. This video models an inequality to explain how floodgates in Venice prevent flooding during storms. The key concept is the activation threshold, where the water level exceeds a critical value. Vocabulary includes inequality, threshold, variable, and model. Using a TI-Nspire, the video demonstrates creating a random variable for water levels and a function to evaluate if floodgates should activate. It illustrates real-world applications in engineering and environmental management.
https://www.media4math.com/library/1523/asset-preview
Teach
Introduction to Linear Inequalities
Use this slide show to review these definitions of inequalities:
https://www.media4math.com/library/slideshow/definitions-inequalities
Provide examples of linear inequalities and discuss their meaning (e.g., 2x + 3 ≤ 7 means that the value of 2x + 3 must be less than or equal to 7).
Graphing Linear Inequalities
Demonstrate how to graph a linear inequality on the coordinate plane by graphing the boundary line and shading the appropriate region. Emphasize the importance of the inequality symbol in determining which region to shade.
Use this selection of clip art images to show the contrast between equations and inequalities with one and two variables:
https://www.media4math.com/library/75525/asset-preview
Use this Desmos activity to explore graphs of linear inequalities:
https://www.desmos.com/calculator/vhqsry1h6b
Use this slide show to look at examples of graphs of linear inequalities:
https://www.media4math.com/library/slideshow/math-examples-linear-inequalities
Solving Linear Inequalities Algebraically
Introduce the process of solving linear inequalities algebraically, similar to solving linear equations. Emphasize the importance of reversing the inequality symbol when multiplying or dividing by a negative number.
Use this slide show to demonstrate how to solve one-step inequalities algebraically:
https://www.media4math.com/library/slideshow/solving-one-step-inequalities
Use this set of math clip art images to demonstrate how to solve linear inequalities:
https://www.media4math.com/library/75527/asset-preview
Example 1: Budgeting for a Trip
Problem: A family is planning a trip and wants to spend no more than \$500 on gas and hotel expenses. If gas costs \$50 per day and the hotel costs \$100 per night, how many days (\( x \)) and nights (\( y \)) can they afford?
- Set up the inequality: \( 50x + 100y \leq 500 \).
- Divide everything by 50: \( x + 2y \leq 10 \).
- Rearrange for graphing: \( x \leq 10 - 2y \).
- The solution set includes all points below or on the boundary line.

Example 2: Restaurant Tip Calculation (Real-World Application)
Problem: A restaurant server earns tips that follow the inequality \( 3x + 5y \geq 60 \), where \( x \) is the number of three-dollar tips and \( y \) is the number of five-dollar tips. What combinations satisfy this inequality?
- Rearrange the inequality: \( 3x + 5y \geq 60 \).
- Rewrite in slope-intercept form: \( y \geq -\frac{3}{5}x + 12 \).
- The solution set includes points above or on the boundary line.

Example 3: Packing Weight Limit (Real-World Application)
Problem: A traveler’s suitcase and backpack together must weigh no more than 40 lbs. The suitcase weighs \( x \) pounds and the backpack weighs \( y \) pounds. Write and solve an inequality.
- Set up the inequality: \( x + y \leq 40 \).
- Rearrange for graphing: \( y \leq 40 - x \).
- The solution set includes all points below or on the boundary line.

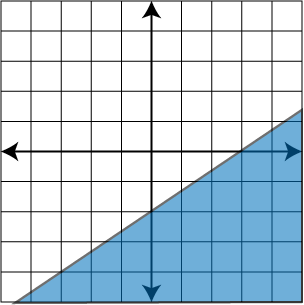
Example 4: Graphing \( y > 2x - 4 \)
- Rewrite in slope-intercept form: \( y > 2x - 4 \).
- Graph the boundary line \( y = 2x - 4 \) (use a dashed line since \( > \) means the boundary is not included).
- Shade the region above the line, where \( y \) values are greater.

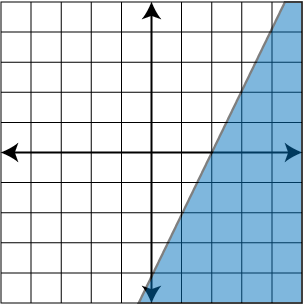
Example 5: Graphing \( 3x - 4y \leq 12 \)
- Rearrange in slope-intercept form: \( y \geq \frac{3}{4}x - 3 \).
- Graph the boundary line \( y = \frac{3}{4}x - 3 \) (use a solid line since \( \leq \) means the boundary is included).
- Shade the region below the line.

Example 6: Graphing \( x + y > 5 \)
- Rewrite in slope-intercept form: \( y > -x + 5 \).
- Graph the boundary line \( y = -x + 5 \) (use a dashed line).
- Shade the region above the line.

Review
Review the key concepts covered in the lesson, including the definition of linear inequalities, graphing linear inequalities, and solving linear inequalities algebraically.
Use this video to see an application of linear inequalities in the context of business:
https://www.media4math.com/library/39668/asset-preview
The first few minutes of this video sets up the scenario and you will see the resulting inequality:
y > -2/3x + 20
While the video shows how to graph this inequality on a TI-Nspire graphing calculator, you can also use Desmos.
Key Vocabulary Review
- Linear Inequality: An inequality that represents a region of the coordinate plane, defined by a boundary line. Examples include \( y > 2x + 1 \) and \( 3x - 4y \leq 8 \).
- Solution Set: The set of all coordinate points that satisfy a given inequality.
- Boundary Line: The line that separates the solutions from non-solutions. A solid line is used for \( \leq \) or \( \geq \), while a dashed line is used for \( < \) or \( > \).
- Shaded Region: The area on a graph that represents all possible solutions to a linear inequality.
- Inequality Symbols:
- \( < \): Less than
- \( > \): Greater than
- \( \leq \): Less than or equal to
- \( \geq \): Greater than or equal to
Example 1: Solving and Graphing \( 4x - 2y \leq 8 \)
- Rearrange into slope-intercept form: \[ -2y \leq -4x + 8 \]
- Divide by -2 (flipping the inequality sign): \[ y \geq 2x - 4 \]
- Graph \( y = 2x - 4 \) using a solid line.
- Shade the region above the line.

Example 2: Solving and Graphing \( x + 3y > 9 \)
- Rearrange into slope-intercept form: \[ 3y > -x + 9 \]
- Divide by 3: \[ y > -\frac{1}{3}x + 3 \]
- Graph \( y = -\frac{1}{3}x + 3 \) using a dashed line.
- Shade the region above the line.

Example 3: Real-World Application – Maximum Spending
Problem: A person is buying groceries and wants to spend no more than \$60. They buy \( x \) items at \$4 each and \( y \) items at \$6 each. Write and graph the inequality.
- Set up the inequality: \[ 4x + 6y \leq 60 \]
- Divide by 2 for simpler numbers: \[ 2x + 3y \leq 30 \]
- Rearrange into slope-intercept form: \[ y \leq -\frac{2}{3}x + 10 \]
- Graph \( y = -\frac{2}{3}x + 10 \) using a solid line.
- Shade below the line.

Example 4: Real-World Application – Work Hours
Problem: A freelancer wants to earn at least \$500 per week. They work \( x \) hours at \$20 per hour and \( y \) hours at \$30 per hour. Write and graph the inequality.
- Set up the inequality: \[ 20x + 30y \geq 500 \]
- Divide by 10: \[ 2x + 3y \geq 50 \]
- Rearrange into slope-intercept form: \[ y \geq -\frac{2}{3}x + \frac{50}{3} \]
- Graph \( y = -\frac{2}{3}x + \frac{50}{3} \) using a solid line.
- Shade above the line.

Quiz
Answer the following questions.
Graph the linear inequality: 2x - 3y ≥ 6
- Solve the linear inequality: 4x + 2y < 10
- Which of the following points does not satisfy the inequality 3x - 2y ≤ 12?
a) (2, 3)
b) (5, 1)
c) (1, 4)
d) (3, 2) - Write an inequality to represent the situation: The cost of a movie ticket is \$8 for adults and \$6 for children, and you have \$50 to spend. What combination of tickets can you purchase?
Graph the linear inequality: y ≥ 2x - 4
- Which of the following points does not satisfy the inequality 2x + y ≤ 6?
a) (1, 2)
b) (2, 0)
c) (0, 4)
d) (3, 1)
Answer Key
- y < -2x + 5
- b
- 8x + 6y ≤ 50
- d