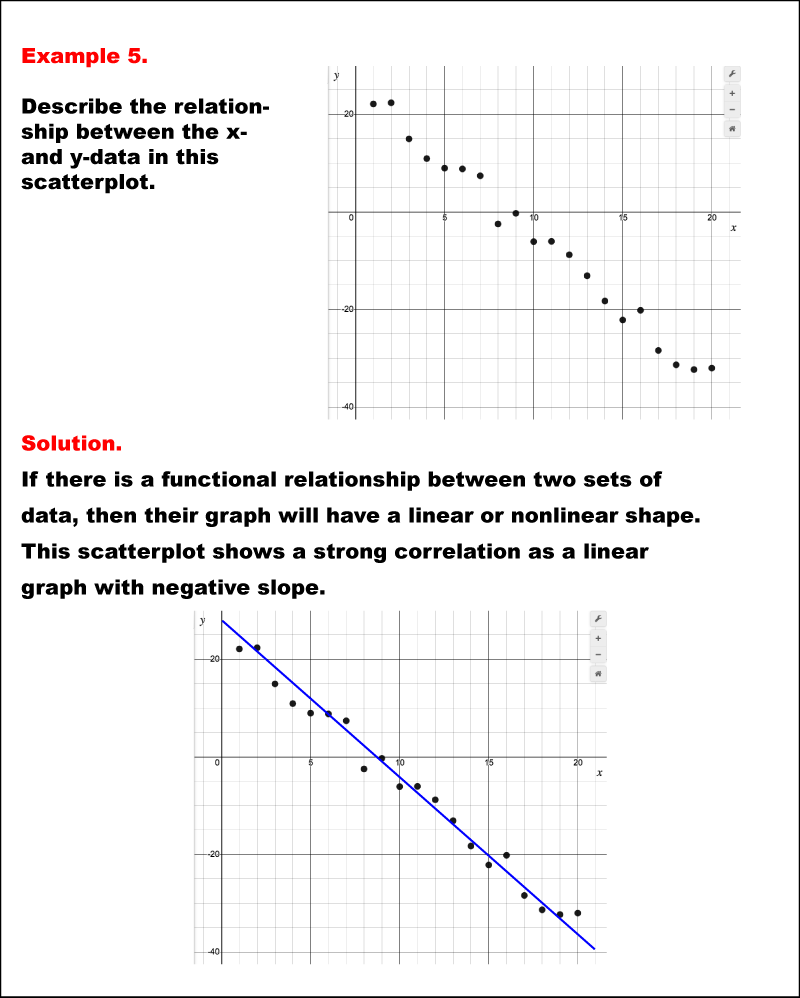
Math Example--Charts, Graphs, and Plots-- Analyzing Scatterplots: Example 5 Grade: 8 - 12 Copyright Year 2020 Format Image
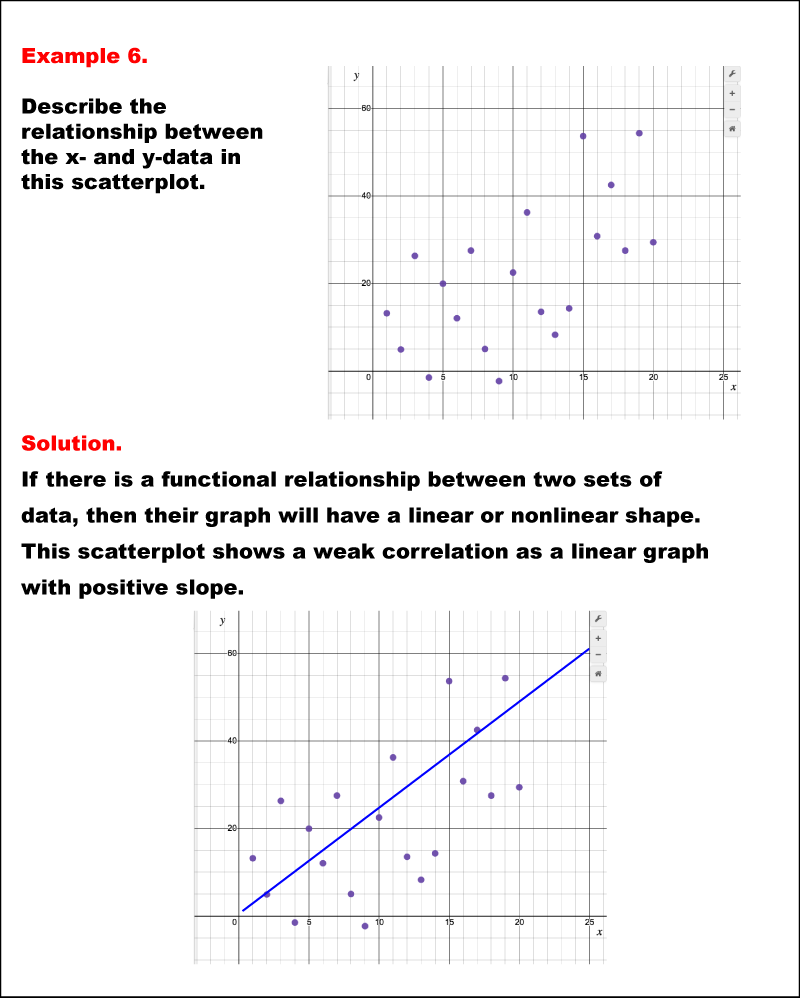
Math Example--Charts, Graphs, and Plots-- Analyzing Scatterplots: Example 6 Grade: 8 - 12 Copyright Year 2020 Format Image
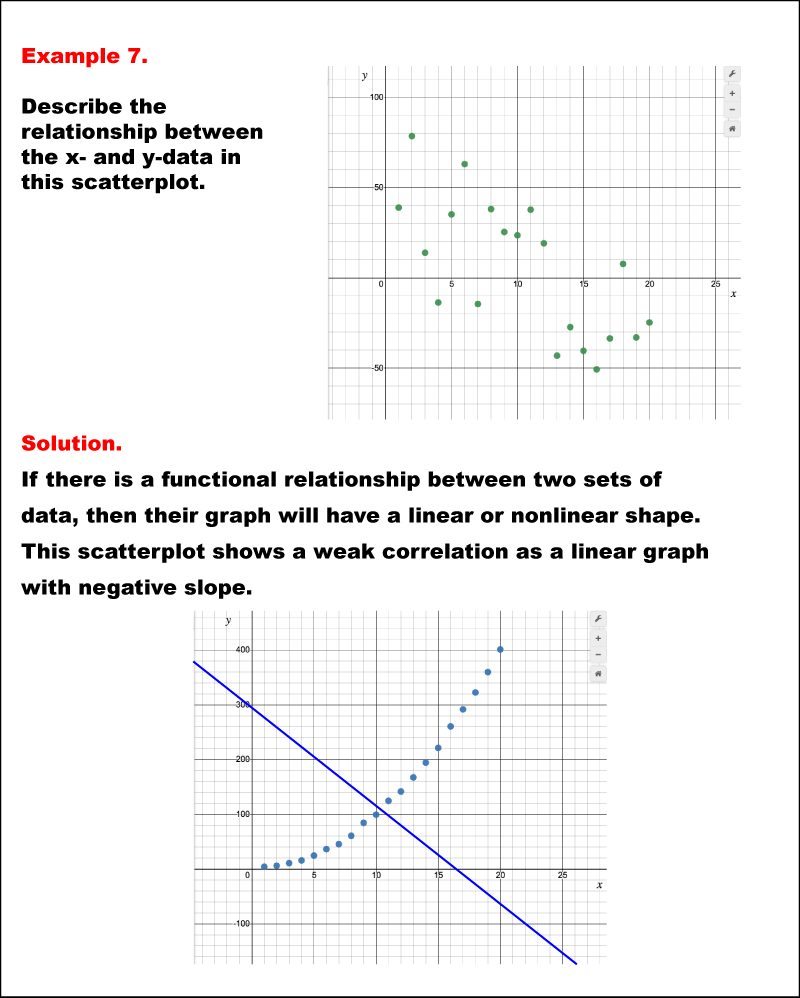
Math Example--Charts, Graphs, and Plots-- Analyzing Scatterplots: Example 7 Grade: 8 - 12 Copyright Year 2020 Format Image
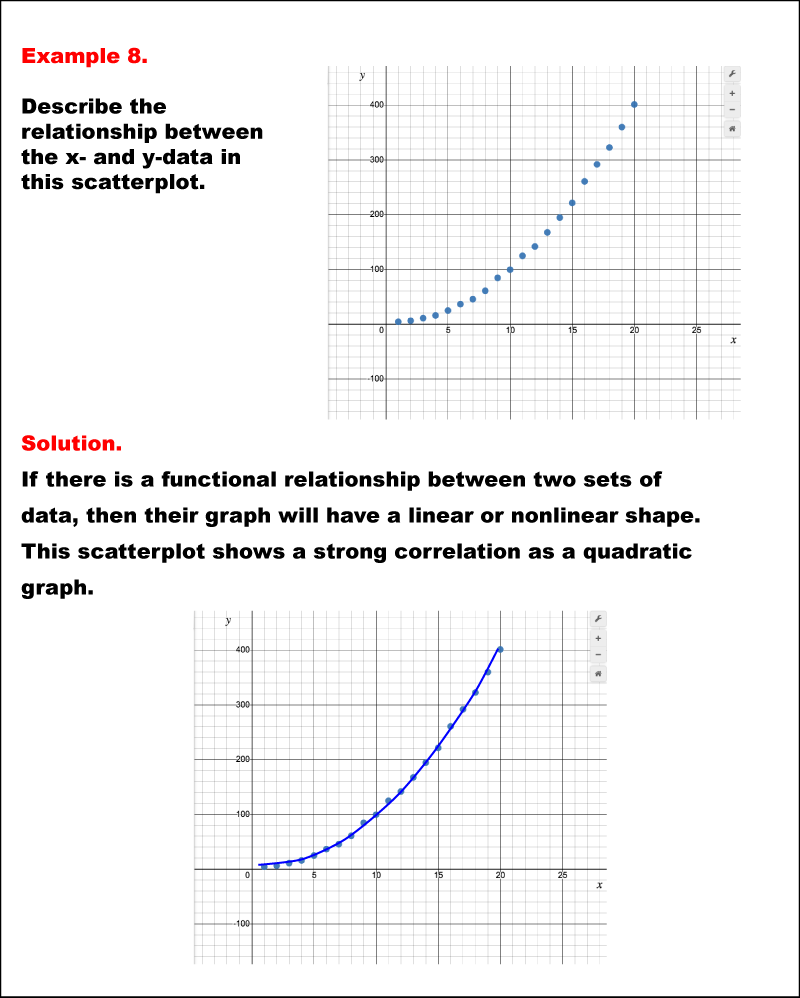
Math Example--Charts, Graphs, and Plots-- Analyzing Scatterplots: Example 8 Grade: 8 - 12 Copyright Year 2020 Format Image
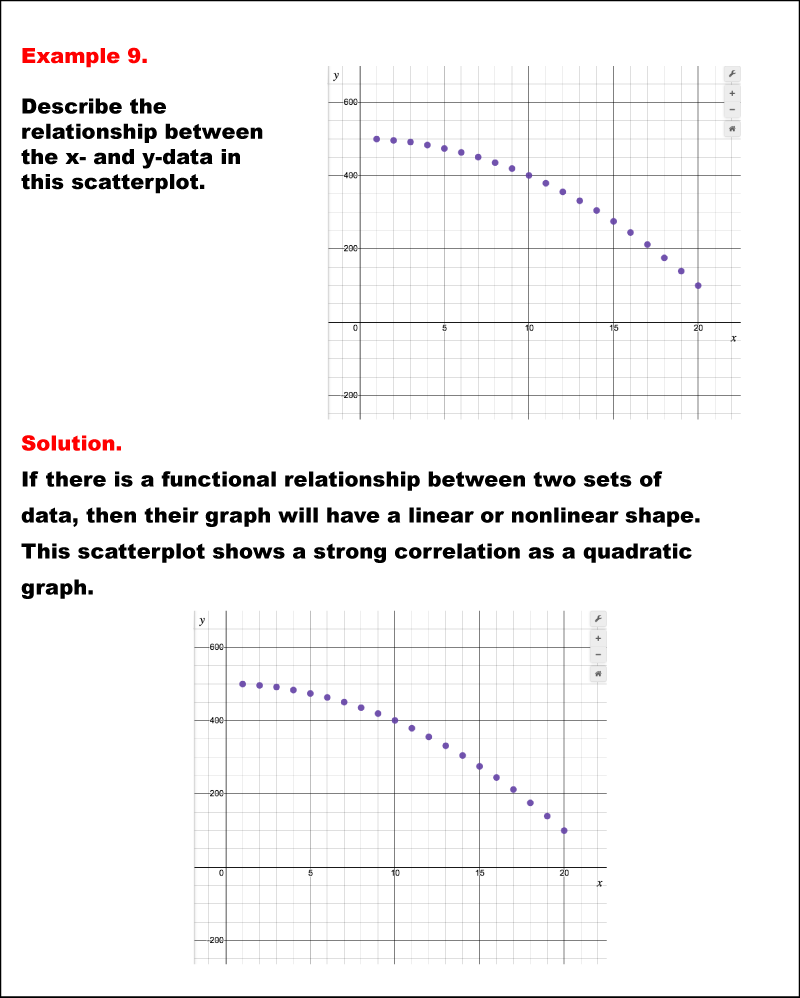
Math Example--Charts, Graphs, and Plots-- Analyzing Scatterplots: Example 9 Grade: 8 - 12 Copyright Year 2020 Format Image
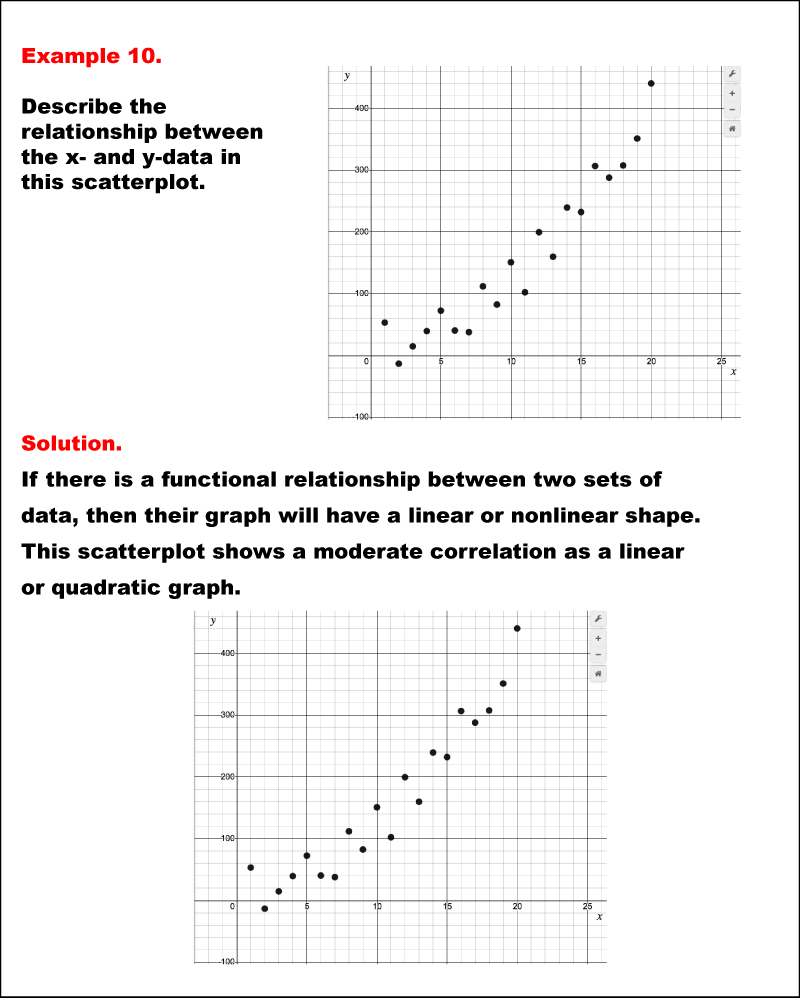
Math Example--Charts, Graphs, and Plots-- Analyzing Scatterplots: Example 10 Grade: 8 - 12 Copyright Year 2020 Format Image
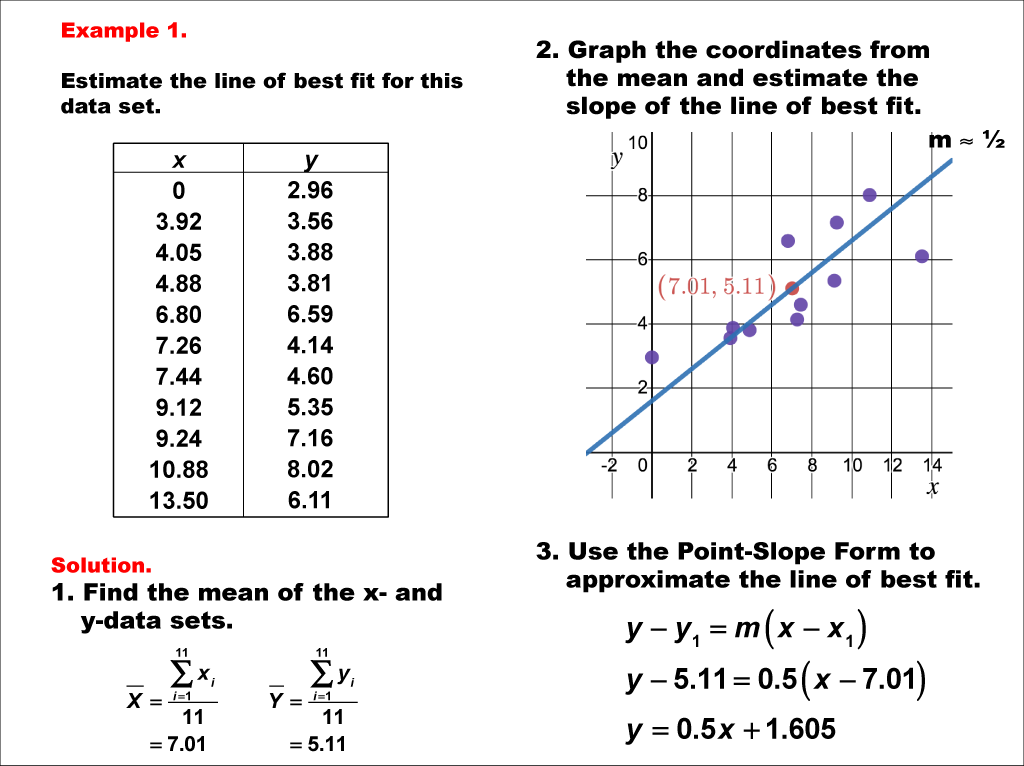
Math Example--Charts, Graphs, and Plots-- Estimating the Line of Best Fit: Example 1 Grade: 8 - 10 Copyright Year 2021 Format Image
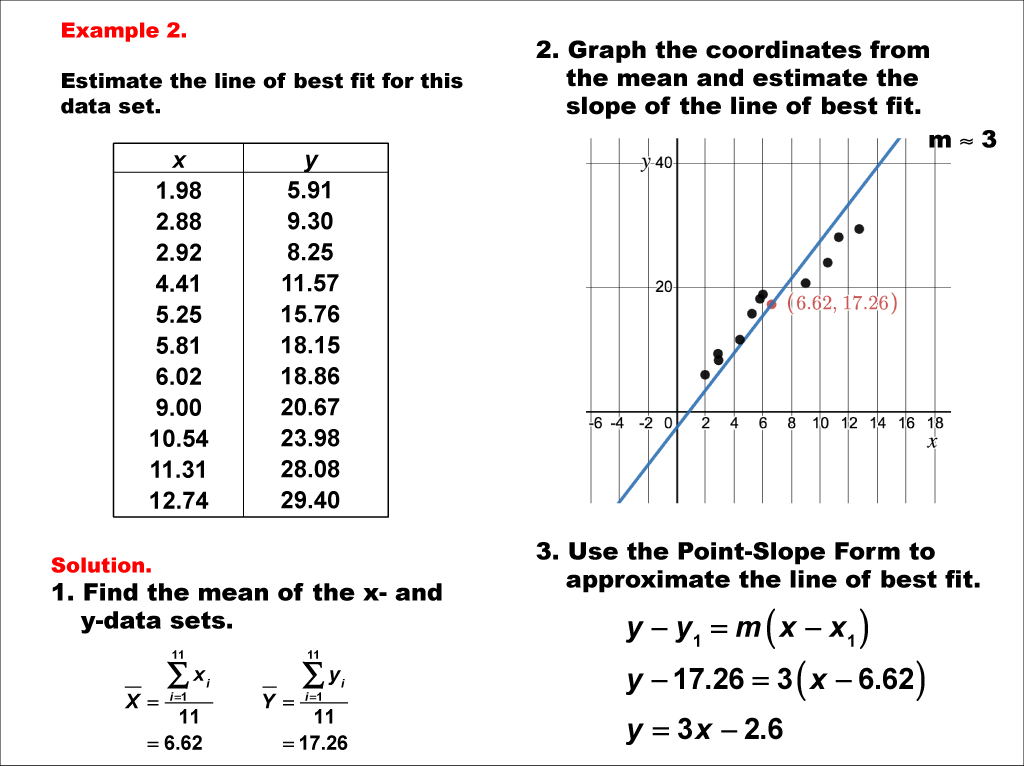
Math Example--Charts, Graphs, and Plots-- Estimating the Line of Best Fit: Example 2 Grade: 8 - 10 Copyright Year 2021 Format Image
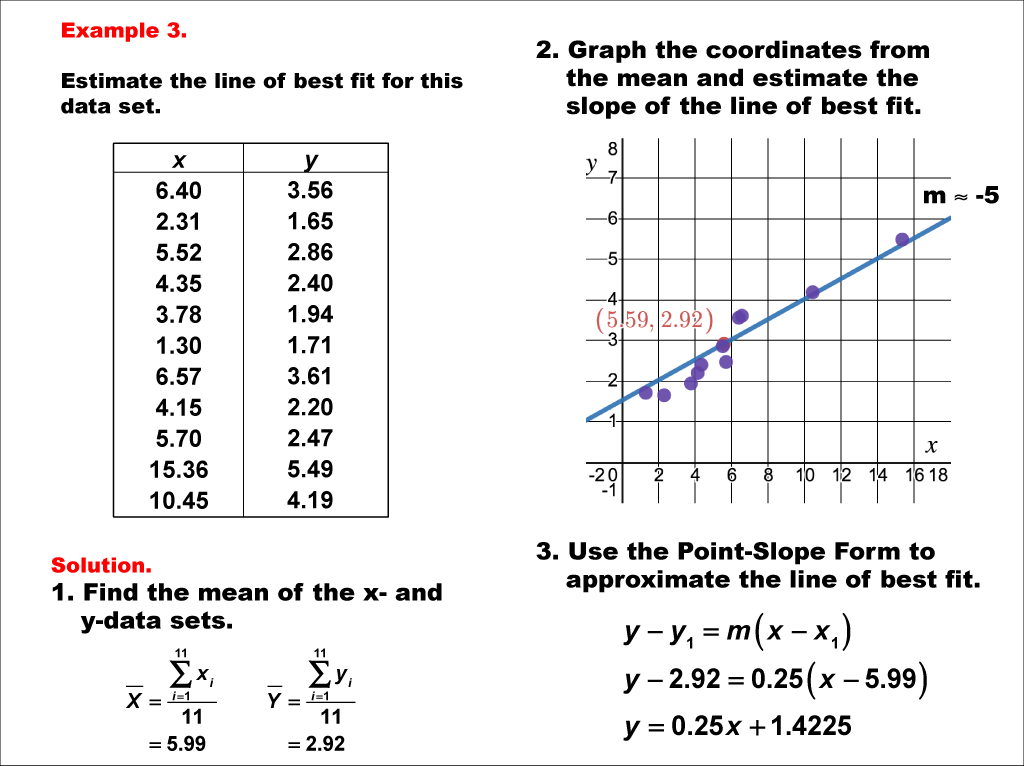
Math Example--Charts, Graphs, and Plots-- Estimating the Line of Best Fit: Example 3 Grade: 8 - 10 Copyright Year 2021 Format Image
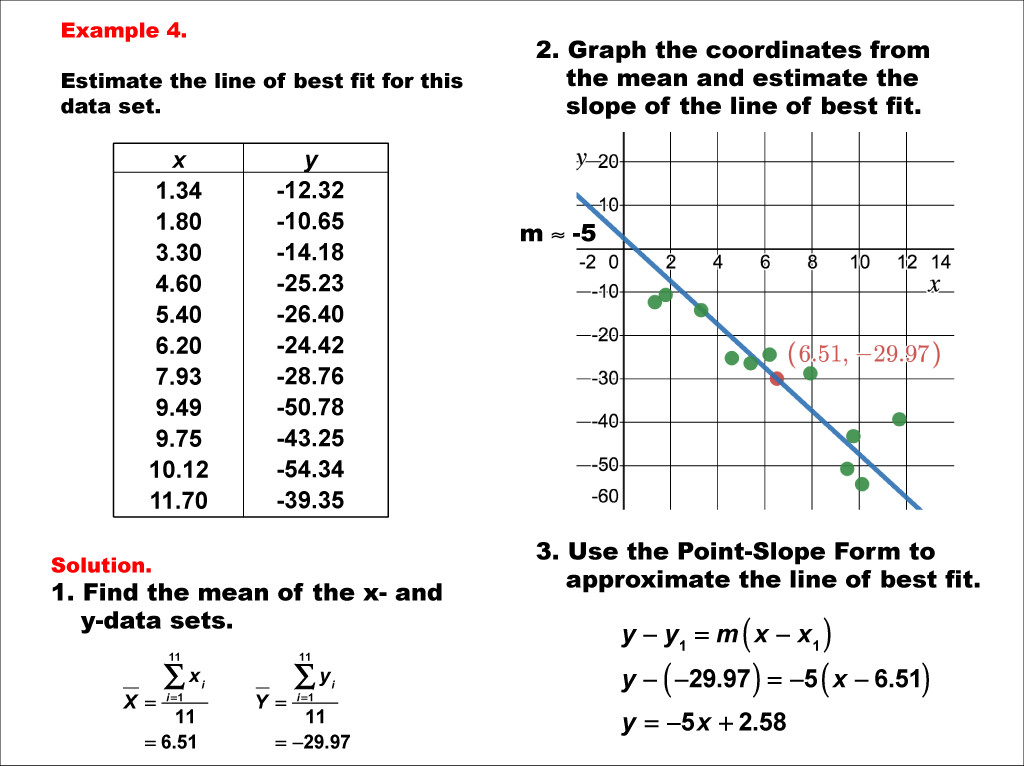
Math Example--Charts, Graphs, and Plots-- Estimating the Line of Best Fit: Example 4 Grade: 8 - 10 Copyright Year 2021 Format Image