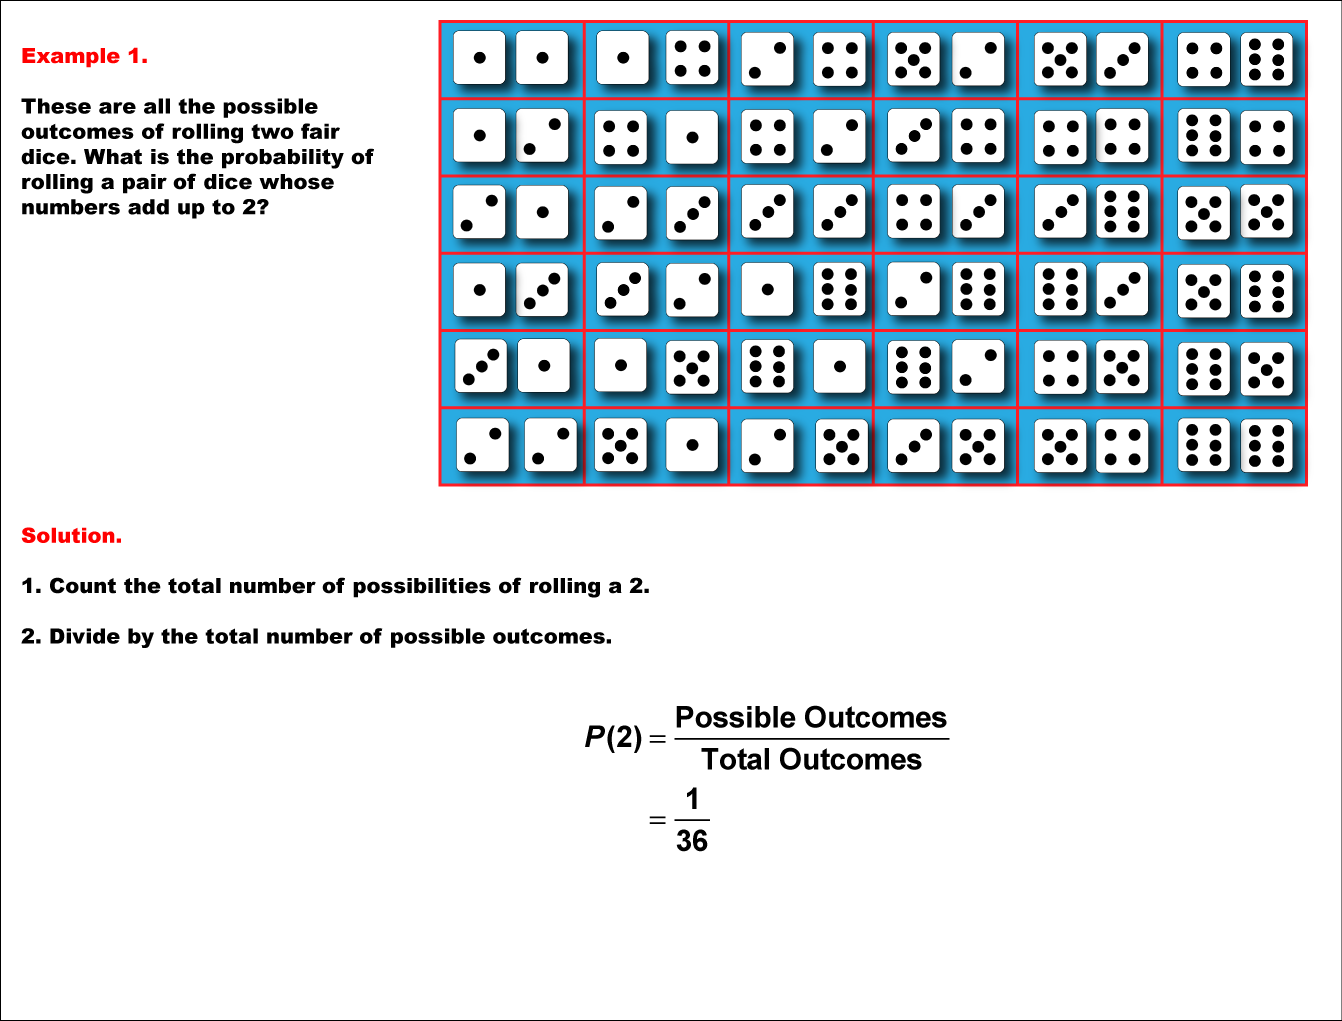
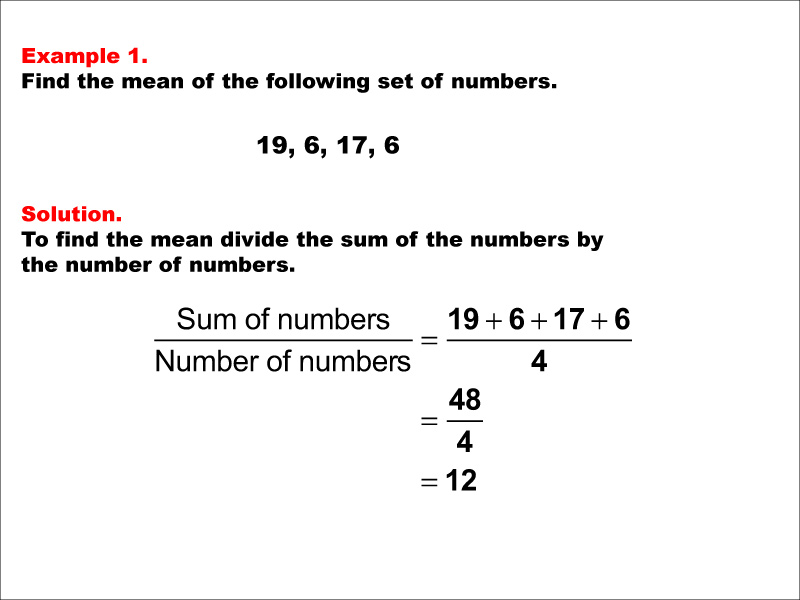
Math Examples Collection: Probability
 | OverviewThis collection aggregates all the math examples around the topic of Probability. There are a total of 28 Math Examples. This collection of resources is made up of downloadable JPG images that you can easily incorporate into your lesson plans. |