
These are the resources that support this North Carolina Standard.
NC.4.MD.4 - Represent and interpret data using whole numbers. Collect data by asking a question that yields numerical data. Make a representation of data and interpret data in a frequency table, scaled bar graph, and/or line plot. Determine whether a survey question will yield categorical or numerical data.
Displaying 1 - 50 of 75 resources:
| Thumbnail Image | Title | Description | Curriculum Nodes |
|---|---|---|---|
|
Math Clip Art Collection: Statistics |
This collection aggregates all the math clip art around the topic of Statistics. There are a total of 55 images. | Data Analysis, Probability, Data Gathering and Counting |
|
Math Definitions Collection: Charts and Graphs |
This collection aggregates all the definition image cards around the topic of Charts and Graphs. There are a total of 16 terms. | Data Analysis |
|
Math Examples Collection: Charts, Graphs, and Plots |
This collection aggregates all the math examples around the topic of Charts, Graphs, and Plots. There are a total of 38 Math Examples. This collection of resources is made up of downloadable PNG images that you can easily incorporate into your lesson plans. | Slope-Intercept Form, Data Analysis, Point-Slope Form and Subtraction Facts to 100 |
|
Math Examples Collection: Graphs From Categorical Data |
This collection aggregates all the math examples around the topic of Graphs of Categorical Data. There are a total of 6 Math Examples. | Data Analysis |

|
Math Examples Collection: Reading Scaled Graphs |
This collection aggregates all the math examples around the topic of Reading Scaled Graphs. There are a total of 13 images. | Subtraction Facts to 100 and Data Analysis |
|
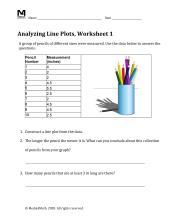
Math Worksheet Collection: Data Analysis |
This collection aggregates all the math worksheets around the topic of Data Analysis. There are a total of 9 worksheets. | Data Analysis |
|
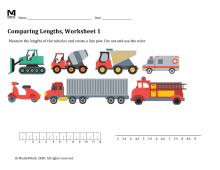
Math Worksheet Collection: Measurement Activities (K-5) |
This collection aggregates all the math worksheets around the topic of Measurement Activities. There are a total of 24 worksheets covering grades K-5. | Length, Add 3-Digit Numbers and Subtract 3-Digit Numbers |
|
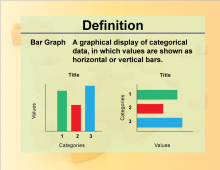
Definition--Charts and Graphs--Bar Graph |
Definition--Charts and Graphs--Bar Graph
This is a collection of definitions related to the concept of charts, graphs, and data displays. |
Data Analysis |
|
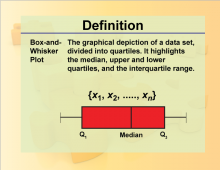
Definition--Charts and Graphs--Box-and-Whisker Plot |
Definition--Charts and Graphs--Box-and-Whisker Plot
This is a collection of definitions related to the concept of charts, graphs, and data displays. |
Data Analysis |
|
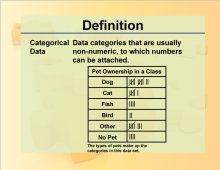
Definition--Charts and Graphs--Categorical Data |
Definition--Charts and Graphs--Categorical Data
This is a collection of definitions related to the concept of charts, graphs, and data displays. |
Data Analysis |
|
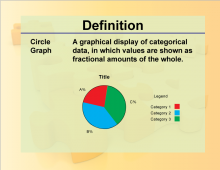
Definition--Charts and Graphs--Circle Graph |
Definition--Charts and Graphs--Circle Graph
This is a collection of definitions related to the concept of charts, graphs, and data displays. |
Data Analysis |
|
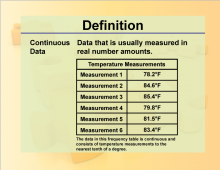
Definition--Charts and Graphs--Continuous Data |
Definition--Charts and Graphs--Continuous Data
This is a collection of definitions related to the concept of charts, graphs, and data displays. |
Data Analysis |
|
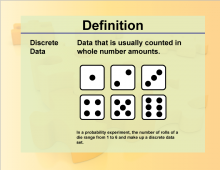
Definition--Charts and Graphs--Discrete Data |
Definition--Charts and Graphs--Discrete Data
This is a collection of definitions related to the concept of charts, graphs, and data displays. |
Data Analysis |
|
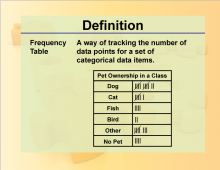
Definition--Charts and Graphs--Frequency Table |
Definition--Charts and Graphs--Frequency Table
This is a collection of definitions related to the concept of charts, graphs, and data displays. |
Data Analysis |
|
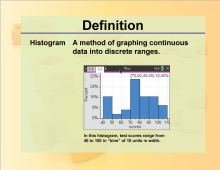
Definition--Charts and Graphs--Histogram |
Definition--Charts and Graphs--Histogram
This is a collection of definitions related to the concept of charts, graphs, and data displays. |
Data Analysis |
|
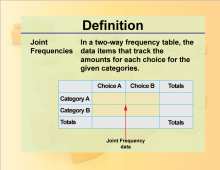
Definition--Charts and Graphs--Joint Frequencies |
Definition--Charts and Graphs--Joint Frequencies
This is a collection of definitions related to the concept of charts, graphs, and data displays. |
Data Analysis |
|
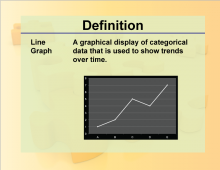
Definition--Charts and Graphs--Line Graph |
Definition--Charts and Graphs--Line Graph
This is a collection of definitions related to the concept of charts, graphs, and data displays. |
Data Analysis |
|
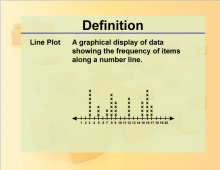
Definition--Charts and Graphs--Line Plot |
Definition--Charts and Graphs--Line Plot
This is a collection of definitions related to the concept of charts, graphs, and data displays. |
Data Analysis |
|
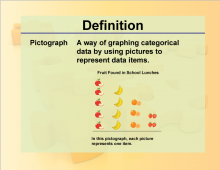
Definition--Charts and Graphs--Pictograph |
Definition--Charts and Graphs--Pictograph
This is a collection of definitions related to the concept of charts, graphs, and data displays. |
Data Analysis |
|
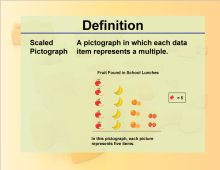
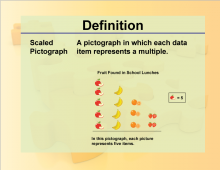
Definition--Charts and Graphs--Scaled Pictograph |
Definition--Charts and Graphs--Scaled Pictograph
This is a collection of definitions related to the concept of charts, graphs, and data displays. |
Data Analysis |
|
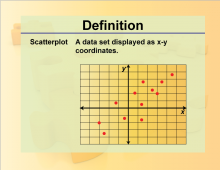
Definition--Charts and Graphs--Scatterplot |
Definition--Charts and Graphs--Scatterplot
This is a collection of definitions related to the concept of charts, graphs, and data displays. |
Data Analysis |
|
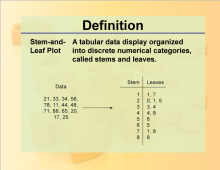
Definition--Charts and Graphs--Stem-and-Leaf Plot |
Definition--Charts and Graphs--Stem-and-Leaf Plot
This is a collection of definitions related to the concept of charts, graphs, and data displays. |
Data Analysis |
|
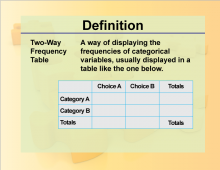
Definition--Charts and Graphs--Two-Way Frequency Table |
Definition--Charts and Graphs--Two-Way Frequency Table
This is a collection of definitions related to the concept of charts, graphs, and data displays. |
Data Analysis |

|
HTML5 Interactive: Data Displays |
HTML5 Interactive: Data Displays
In this interactive, review seven commonly used data displays. Provides a quck review tool for a unit on data analysis. Note: the download is the Teacher's Guide. |
Data Gathering and Data Analysis |

|
Interactive Word Search Puzzle--Data Analysis, Puzzle 1 |
Interactive Word Search Puzzle--Data Analysis, Puzzle 1
Solve an interactive word search puzzle on the topic of Data Analysis. |
Data Analysis |

|
Interactive Word Search Puzzle--Data Analysis, Puzzle 2 |
Interactive Word Search Puzzle--Data Analysis, Puzzle 2
Solve an interactive word search puzzle on the topic of Data Analysis. |
Data Analysis |

|
Interactive Word Search Puzzle--Data Analysis, Puzzle 3 |
Interactive Word Search Puzzle--Data Analysis, Puzzle 3
Solve an interactive word search puzzle on the topic of Data Analysis. |
Data Analysis |

|
Interactive Word Search Puzzle--Data Analysis, Puzzle 4 |
Interactive Word Search Puzzle--Data Analysis, Puzzle 4
Solve an interactive word search puzzle on the topic of Data Analysis. |
Data Analysis |
|
Interactive Word Search Puzzle--Data Analysis, Puzzle 5 |
Interactive Word Search Puzzle--Data Analysis, Puzzle 5
Solve an interactive word search puzzle on the topic of Data Analysis. |
Data Analysis |

|
Math Clip Art--Statistics and Probability--Basic Line Plot |
Math Clip Art--Statistics and Probability--Basic Line Plot
This is part of a collection of math clip art images that show different statistical graphs and concepts, along with some probability concepts. |
Length |
|
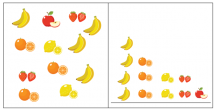
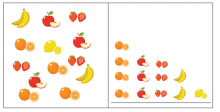
Math Clip Art--Statistics--Fruit Pictograph-1 |
Math Clip Art--Statistics--Fruit Pictograph-1
This is part of a collection of math clip art images that show different statistical graphs and concepts, along with some probability concepts. |
Counting |
|
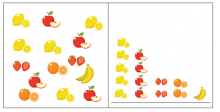
Math Clip Art--Statistics--Fruit Pictograph-2 |
Math Clip Art--Statistics--Fruit Pictograph-2
This is part of a collection of math clip art images that show different statistical graphs and concepts, along with some probability concepts. |
Counting |
|
Math Clip Art--Statistics--Fruit Pictograph-3 |
Math Clip Art--Statistics--Fruit Pictograph-3
This is part of a collection of math clip art images that show different statistical graphs and concepts, along with some probability concepts. |
Counting |
|
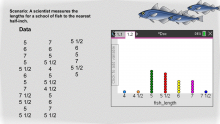
Math Clip Art--Statistics--Line Plots with Data--01 |
Math Clip Art--Statistics--Line Plots with Data--01 This is part of a collection of math clip art images that show different statistical graphs and concepts, along with some probability concepts. |
Data Analysis |
|
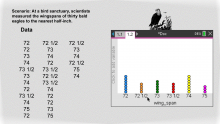
Math Clip Art--Statistics--Line Plots with Data--02 |
Math Clip Art--Statistics--Line Plots with Data--02 This is part of a collection of math clip art images that show different statistical graphs and concepts, along with some probability concepts. |
Data Analysis |
|
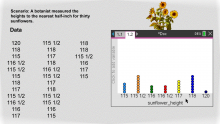
Math Clip Art--Statistics--Line Plots with Data--03 |
Math Clip Art--Statistics--Line Plots with Data--03 This is part of a collection of math clip art images that show different statistical graphs and concepts, along with some probability concepts. |
Data Analysis |
|
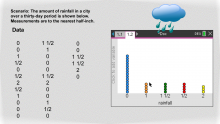
Math Clip Art--Statistics--Line Plots with Data--04 |
Math Clip Art--Statistics--Line Plots with Data--04 This is part of a collection of math clip art images that show different statistical graphs and concepts, along with some probability concepts. |
Data Analysis |
|
Math Clip Art--Statistics--Line Plots with Data--05 |
Math Clip Art--Statistics--Line Plots with Data--05 This is part of a collection of math clip art images that show different statistical graphs and concepts, along with some probability concepts. |
Data Analysis |
|
Math Clip Art--Statistics--Line Plots with Data--06 |
Math Clip Art--Statistics--Line Plots with Data--06 This is part of a collection of math clip art images that show different statistical graphs and concepts, along with some probability concepts. |
Data Analysis |
|
Math Clip Art--Statistics--Line Plots with Data--07 |
Math Clip Art--Statistics--Line Plots with Data--07 This is part of a collection of math clip art images that show different statistical graphs and concepts, along with some probability concepts. |
Data Analysis |
|
Math Clip Art--Statistics--Line Plots with Data--08 |
Math Clip Art--Statistics--Line Plots with Data--08 This is part of a collection of math clip art images that show different statistical graphs and concepts, along with some probability concepts. |
Data Analysis |
|
Math Clip Art--Statistics--Line Plots with Data--09 |
Math Clip Art--Statistics--Line Plots with Data--09 This is part of a collection of math clip art images that show different statistical graphs and concepts, along with some probability concepts. |
Data Analysis |
|
Math Clip Art--Statistics--Line Plots with Data--10 |
Math Clip Art--Statistics--Line Plots with Data--10 This is part of a collection of math clip art images that show different statistical graphs and concepts, along with some probability concepts. |
Data Analysis |

|
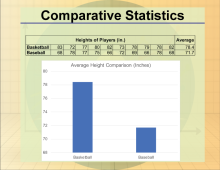
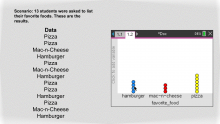
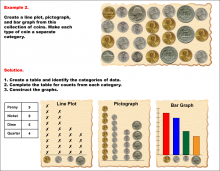
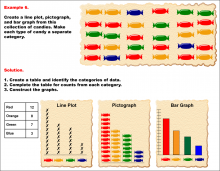
Math Example--Charts, Graphs, and Plots--Graphs of Categorical Data--Example 1 |
Math Example--Charts, Graphs, and Plots-- Graphs of Categorical Data--Example 1
In this set of math examples, analyze the behavior of different scatterplots. This includes linear and quadratic models. |
Data Analysis |
|
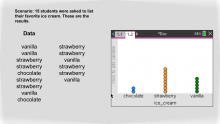
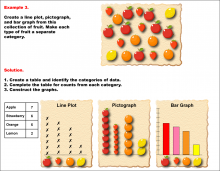
Math Example--Charts, Graphs, and Plots--Graphs of Categorical Data--Example 2 |
Math Example--Charts, Graphs, and Plots-- Graphs of Categorical Data--Example 2
In this set of math examples, analyze the behavior of different scatterplots. This includes linear and quadratic models. |
Data Analysis |
|
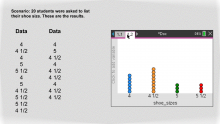
Math Example--Charts, Graphs, and Plots--Graphs of Categorical Data--Example 3 |
Math Example--Charts, Graphs, and Plots-- Graphs of Categorical Data--Example 3
In this set of math examples, analyze the behavior of different scatterplots. This includes linear and quadratic models. |
Data Analysis |
|
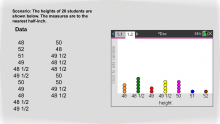
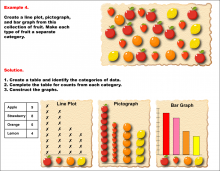
Math Example--Charts, Graphs, and Plots--Graphs of Categorical Data--Example 4 |
Math Example--Charts, Graphs, and Plots-- Graphs of Categorical Data--Example 4
In this set of math examples, analyze the behavior of different scatterplots. This includes linear and quadratic models. |
Data Analysis |
|
Math Example--Charts, Graphs, and Plots--Graphs of Categorical Data--Example 5 |
Math Example--Charts, Graphs, and Plots-- Graphs of Categorical Data--Example 5
In this set of math examples, analyze the behavior of different scatterplots. This includes linear and quadratic models. |
Data Analysis |
|
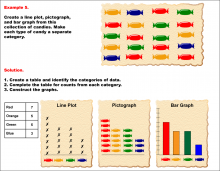
Math Example--Charts, Graphs, and Plots--Graphs of Categorical Data--Example 6 |
Math Example--Charts, Graphs, and Plots-- Graphs of Categorical Data--Example 6
In this set of math examples, analyze the behavior of different scatterplots. This includes linear and quadratic models. |
Data Analysis |
|
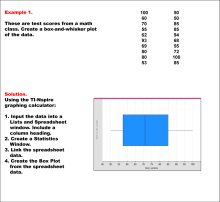
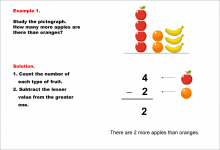
Math Example--Charts, Graphs, and Plots--Reading and Interpreting Scaled Graphs--Example 1 |
Math Example--Charts, Graphs, and Plots-- Reading and Interpreting Scaled Graphs--Example 1
In this set of math examples, analyze the behavior of different scatterplots. |
Subtraction Facts to 100 and Data Analysis |