
These are the resources that support this North Carolina Standard.
NC.6.SP.4 - Display numerical data in plots on a number line. Use dot plots, histograms, and box plots to represent data. Compare the attributes of different representations of the same data.
Displaying 1 - 13 of 13 resources:
| Thumbnail Image | Title | Description | Curriculum Nodes |
|---|---|---|---|
|
Math Examples Collection: Charts, Graphs, and Plots |
This collection aggregates all the math examples around the topic of Charts, Graphs, and Plots. There are a total of 38 Math Examples. This collection of resources is made up of downloadable PNG images that you can easily incorporate into your lesson plans. | Slope-Intercept Form, Data Analysis, Point-Slope Form and Subtraction Facts to 100 |

|
Math Examples Collection: Data Plots |
This collection aggregates all the math examples around the topic of Data Plots. There are a total of 4 Math Examples. | Data Analysis |
|
Math Video Collection: Texas Instruments Tutorial Videos |
This collection aggregates all the math videos and resources in this series: Texas Instruments Tutorial Videos. There are a total of 266 resources. | Rational Expressions, Sequences, Series, Polynomial Functions and Equations, Graphs of Quadratic Functions, Quadratic Equations and Functions, Solving Systems of Equations, Trig Expressions and Identities, Probability, Geometric Constructions with Triangles, Composite Functions, Geometric Constructions with Angles and Planes, Distance Formula, Data Analysis, Slope, Special Functions, Trigonometric Functions, Graphs of Exponential and Logarithmic Functions, Radical Functions and Equations, Rational Functions and Equations, Slope-Intercept Form, Coordinate Systems, Graphs of Linear Functions, Inequalities, Matrix Operations and Midpoint Formula |
|
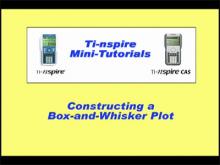
Closed Captioned Video: Box-and-Whisker Plot |
Closed Captioned Video: Box-and-Whisker Plot
In this TI Nspire tutorial the Spreadsheet and Statistics windows are used to create a box-and-whisker plot. |
Data Analysis |
|
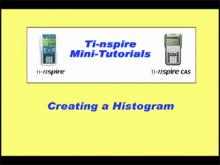
Closed Captioned Video: Creating a Histogram |
Closed Captioned Video: Creating a Histogram
In this TI Nspire tutorial, the Spreadsheet and Statistics windows are used to create a histogram. This video supports the TI-Nspire Clickpad and Touchpad. |
Data Analysis |
|
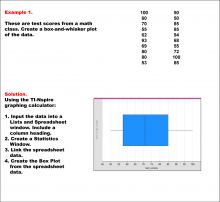
Math Example--Charts, Graphs, and Plots--Data Plot--Example 1 |
Math Example--Charts, Graphs, and Plots-- Data Plot--Example 1
In this set of math examples, analyze the behavior of different scatterplots. This includes linear and quadratic models. |
Data Analysis |
|
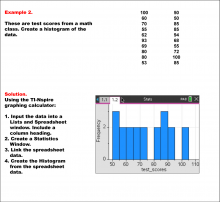
Math Example--Charts, Graphs, and Plots--Data Plot--Example 2 |
Math Example--Charts, Graphs, and Plots-- Data Plot--Example 2
In this set of math examples, analyze the behavior of different scatterplots. This includes linear and quadratic models. |
Data Analysis |
|
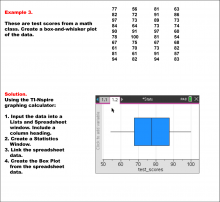
Math Example--Charts, Graphs, and Plots--Data Plot--Example 3 |
Math Example--Charts, Graphs, and Plots-- Data Plot--Example 3
In this set of math examples, analyze the behavior of different scatterplots. This includes linear and quadratic models. |
Data Analysis |
|
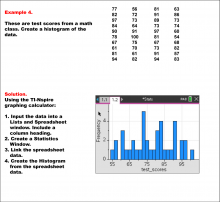
Math Example--Charts, Graphs, and Plots--Data Plot--Example 4 |
Math Example--Charts, Graphs, and Plots-- Data Plot--Example 4
In this set of math examples, analyze the behavior of different scatterplots. This includes linear and quadratic models. |
Data Analysis |

|
Video Transcript: TI-Nspire Mini-Tutorial: Creating a Histogram |
Video Transcript: TI-Nspire Mini-Tutorial: Creating a Histogram
This is the transcript for the TI-Nspire Mini-Tutorial entitled, Creating a Histogram. |
Data Analysis |
|
|
Video Transcript: TI-Nspire Mini-Tutorial: Graphing a Box-and-Whisker Plot |
Video Transcript: TI-Nspire Mini-Tutorial: Graphing a Box-and-Whisker Plot
This is the transcript for the TI-Nspire Mini-Tutorial entitled, Graphing a Box-and-Whisker Plot. |
Data Analysis |
|
Worksheet: TI-Nspire Mini-Tutorial: Creating a Histogram |
Worksheet: TI-Nspire Mini-Tutorial: Creating a Histogram
This is part of a collection of math worksheets on the use of the TI-Nspire graphing calculator. |
Data Analysis |
|
|
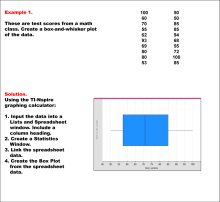
Worksheet: TI-Nspire Mini-Tutorial: Graphing a Box-and-Whisker Plot |
Worksheet: TI-Nspire Mini-Tutorial: Graphing a Box-and-Whisker Plot
This is part of a collection of math worksheets on the use of the TI-Nspire graphing calculator. |
Data Analysis |