
These are the resources that support this North Carolina Standard.
NC.6.SP.5 - Summarize numerical data sets in relation to their context. a. Describe the collected data by: Reporting the number of observations in dot plots and histograms. Communicating the nature of the attribute under investigation, how it was measured, and the units of measurement. b. Analyze center and variability by: Giving quantitative measures of center, describing variability, and any overall pattern, and noting any striking deviations. Justifying the appropriate choice of measures of center using the shape of the data distribution.
Displaying 1 - 4 of 4 resources:
| Thumbnail Image | Title | Description | Curriculum Nodes |
|---|---|---|---|
|
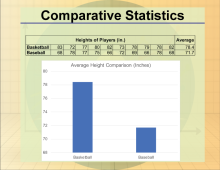
Math Clip Art Collection: Statistics |
This collection aggregates all the math clip art around the topic of Statistics. There are a total of 55 images. | Data Analysis, Probability, Data Gathering and Counting |
|
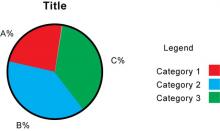
Math Clip Art--Statistics and Probability--Circle Graph |
Math Clip Art--Statistics and Probability--Circle Graph
This is part of a collection of math clip art images that show different statistical graphs and concepts, along with some probability concepts. |
Data Analysis |
|
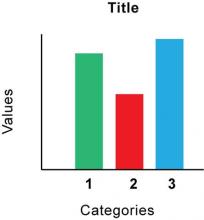
Math Clip Art--Statistics--Bar Graph |
Math Clip Art--Statistics--Bar Graph
This is part of a collection of math clip art images that show different statistical graphs and concepts, along with some probability concepts. |
Data Analysis |
|
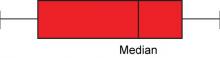
Math Clip Art--Statistics--Box and Whisker Plot |
Math Clip Art--Statistics--Box and Whisker Plot
This is part of a collection of math clip art images that show different statistical graphs and concepts, along with some probability concepts. |
Data Analysis |