
These are the resources that support this South Carolina Standard.
FA.SPID.6 - Using technology, create scatterplots and analyze those plots to compare the fit of linear, quadratic, or exponential models to a given data set. Select the appropriate model, fit a function to the data set, and use the function to solve problems in the context of the data.
Displaying 1 - 49 of 49 resources:
| Thumbnail Image | Title | Description | Curriculum Nodes |
|---|---|---|---|
|
Closed Captioned Video: Multiseries Scatterplot |
Closed Captioned Video: Multiseries Scatterplot
In this TI Nspire tutorial, Spreadsheet and Graph windows are used to graph a multiseries scatterplot. This video supports the TI-Nspire Clickpad and Touchpad. |
Data Analysis |
|
Closed Captioned Video: Scatterplot 1 |
Closed Captioned Video: Scatterplot 1
In this TI Nspire tutorial, Spreadsheet and Graph windows are used to graph a scatterplot. This video supports the TI-Nspire Clickpad and Touchpad. |
Data Analysis |
|
Closed Captioned Video: Scatterplot 2 |
Closed Captioned Video: Scatterplot 2
In this TI Nspire tutorial, Spreadsheet and Statistics windows are used to graph a scatterplot. This video supports the TI-Nspire Clickpad and Touchpad. |
Data Analysis |
|
Closed Captioned Video: Algebra Applications: Data Analysis |
Closed Captioned Video: Algebra Applications: Data Analysis
In this episode of Algebra Applications, students explore the dramatic events of 2008 related to the mortgage crisis. |
Data Analysis and Data Gathering |

|
Closed Captioned Video: Algebra Applications: Data Analysis, 1 |
Closed Captioned Video: Algebra Applications: Data Analysis, Segment 1: Introduction
In this introductory segment students learn about the mortage crisis of 2008. |
Data Analysis and Data Gathering |
|
Closed Captioned Video: Algebra Applications: Data Analysis, 2 |
Closed Captioned Video: Algebra Applications: Data Analysis, Segment 2: What Is a Mortgage?
The time value of money is at the basis of all loans. |
Data Analysis and Data Gathering |
|
Closed Captioned Video: Algebra Applications: Data Analysis, 3 |
Closed Captioned Video: Algebra Applications: Data Analysis, Segment 3: What Is a What is a Subprime Mortgage?
Having learned the general features of a mortgage, students learn the specifics of a subprime mor |
Data Analysis and Data Gathering |
|
Closed Captioned Video: Algebra Applications: Data Analysis, 4 |
Closed Captioned Video: Algebra Applications: Data Analysis, Segment 4: What is an Adjustable Rate Mortgage?
Another factor in the mortgage crisis was the use of adjustable rate mortgages. |
Data Analysis and Data Gathering |
|
Closed Captioned Video: Algebra Nspirations: Data Analysis and Probability |
Closed Captioned Video: Algebra Nspirations: Data Analysis and Probability
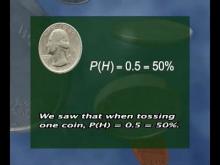
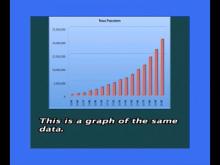
What are the two meanings of statistics? What does it really mean that an event has a 50% probability of occurring? |
Data Analysis and Data Gathering |
|
Closed Captioned Video: Algebra Nspirations: Data Analysis and Probability, 1 |
Closed Captioned Video: Algebra Nspirations: Data Analysis and Probability, Segment 1
In this Investigation we explore uncertainty and randomness. |
Data Analysis and Data Gathering |
|
Closed Captioned Video: Algebra Nspirations: Data Analysis and Probability, 3 |
Closed Captioned Video: Algebra Nspirations: Data Analysis and Probability, Segment 3
In this Investigation we look at real-world data involving endangered wolf populations. |
Data Analysis and Data Gathering |
|
Math Example--Charts, Graphs, and Plots--Analyzing Scatterplots: Example 1 |
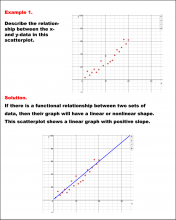
Math Example--Charts, Graphs, and Plots-- Analyzing Scatterplots: Example 1
In this set of math examples, analyze the behavior of different scatterplots. This includes linear and quadratic models. |
Data Analysis |
|
Math Example--Charts, Graphs, and Plots--Analyzing Scatterplots: Example 10 |
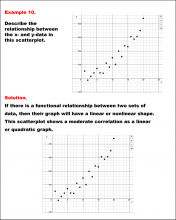
Math Example--Charts, Graphs, and Plots-- Analyzing Scatterplots: Example 10
In this set of math examples, analyze the behavior of different scatterplots. This includes linear and quadratic models. |
Data Analysis |
|
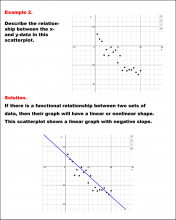
Math Example--Charts, Graphs, and Plots--Analyzing Scatterplots: Example 2 |
Math Example--Charts, Graphs, and Plots-- Analyzing Scatterplots: Example 2
In this set of math examples, analyze the behavior of different scatterplots. This includes linear and quadratic models. |
Data Analysis |

|
Math Example--Charts, Graphs, and Plots--Analyzing Scatterplots: Example 3 |
Math Example--Charts, Graphs, and Plots-- Analyzing Scatterplots: Example 3
In this set of math examples, analyze the behavior of different scatterplots. This includes linear and quadratic models. |
Data Analysis |
|
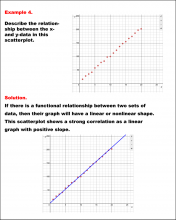
Math Example--Charts, Graphs, and Plots--Analyzing Scatterplots: Example 4 |
Math Example--Charts, Graphs, and Plots-- Analyzing Scatterplots: Example 4
In this set of math examples, analyze the behavior of different scatterplots. This includes linear and quadratic models. |
Data Analysis |
|
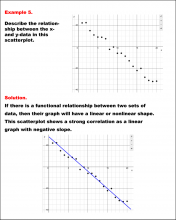
Math Example--Charts, Graphs, and Plots--Analyzing Scatterplots: Example 5 |
Math Example--Charts, Graphs, and Plots-- Analyzing Scatterplots: Example 5
In this set of math examples, analyze the behavior of different scatterplots. This includes linear and quadratic models. |
Data Analysis |
|
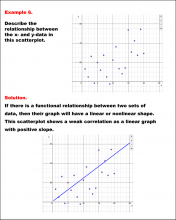
Math Example--Charts, Graphs, and Plots--Analyzing Scatterplots: Example 6 |
Math Example--Charts, Graphs, and Plots-- Analyzing Scatterplots: Example 6
In this set of math examples, analyze the behavior of different scatterplots. This includes linear and quadratic models. |
Data Analysis |
|
Math Example--Charts, Graphs, and Plots--Analyzing Scatterplots: Example 7 |
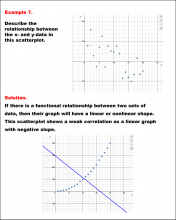
Math Example--Charts, Graphs, and Plots-- Analyzing Scatterplots: Example 7
In this set of math examples, analyze the behavior of different scatterplots. This includes linear and quadratic models. |
Data Analysis |
|
Math Example--Charts, Graphs, and Plots--Analyzing Scatterplots: Example 8 |
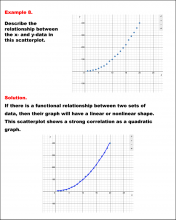
Math Example--Charts, Graphs, and Plots-- Analyzing Scatterplots: Example 8
In this set of math examples, analyze the behavior of different scatterplots. This includes linear and quadratic models. |
Data Analysis |
|
Math Example--Charts, Graphs, and Plots--Analyzing Scatterplots: Example 9 |
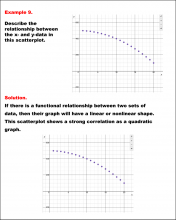
Math Example--Charts, Graphs, and Plots-- Analyzing Scatterplots: Example 9
In this set of math examples, analyze the behavior of different scatterplots. This includes linear and quadratic models. |
Data Analysis |
|
Math Example--Charts, Graphs, and Plots--Estimating the Line of Best Fit: Example 1 |
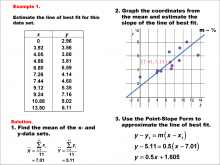
Math Example--Charts, Graphs, and Plots-- Estimating the Line of Best Fit: Example 1
In this set of math examples, analyze the behavior of different scatterplots. |
Slope-Intercept Form and Data Analysis |
|
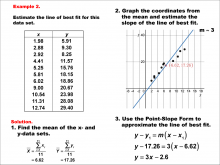
Math Example--Charts, Graphs, and Plots--Estimating the Line of Best Fit: Example 2 |
Math Example--Charts, Graphs, and Plots-- Estimating the Line of Best Fit: Example 2
In this set of math examples, analyze the behavior of different scatterplots. |
Point-Slope Form, Slope-Intercept Form and Data Analysis |
|
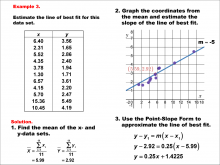
Math Example--Charts, Graphs, and Plots--Estimating the Line of Best Fit: Example 3 |
Math Example--Charts, Graphs, and Plots-- Estimating the Line of Best Fit: Example 3
In this set of math examples, analyze the behavior of different scatterplots. |
Point-Slope Form, Slope-Intercept Form and Data Analysis |
|
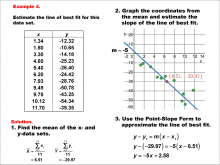
Math Example--Charts, Graphs, and Plots--Estimating the Line of Best Fit: Example 4 |
Math Example--Charts, Graphs, and Plots-- Estimating the Line of Best Fit: Example 4
In this set of math examples, analyze the behavior of different scatterplots. |
Point-Slope Form, Slope-Intercept Form and Data Analysis |
|
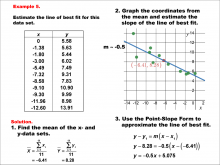
Math Example--Charts, Graphs, and Plots--Estimating the Line of Best Fit: Example 5 |
Math Example--Charts, Graphs, and Plots-- Estimating the Line of Best Fit: Example 5
In this set of math examples, analyze the behavior of different scatterplots. |
Point-Slope Form, Slope-Intercept Form and Data Analysis |

|
Video Transcript: Algebra Applications: Data Analysis |
Video Transcript: Algebra Applications: Data Analysis
This is the transcript for the video of same title. |
Data Analysis |
|
|
Video Transcript: Algebra Applications: Data Analysis, Segment 1: Introduction |
Video Transcript: Algebra Applications: Data Analysis, Segment 1: Introduction
This is the transcript for the video of same title. |
Data Analysis |
|
|
Video Transcript: Algebra Applications: Data Analysis, Segment 2: What Is a Mortgage? |
Video Transcript: Algebra Applications: Data Analysis, Segment 2: What Is a Mortgage?
This is the transcript for the video of same title. Video contents: The time value of money is at the basis of all loans. |
Data Analysis |
|
|
Video Transcript: Algebra Applications: Data Analysis, Segment 3: What is a Subprime Mortgage? |
Video Transcript: Algebra Applications: Data Analysis, Segment 3: What is a Subprime Mortgage?
This is the transcript for the video of same title. |
Data Analysis |
|
|
Video Transcript: Algebra Applications: Data Analysis, Segment 4: What is an Adjustable Rate Mortgage? |
Video Transcript: Algebra Applications: Data Analysis, Segment 4: What is an Adjustable Rate Mortgage?
This is the transcript for the video of same title. |
Data Analysis |
|
|
Video Transcript: Algebra Nspirations: Data Analysis and Probability |
Video Transcript: Algebra Nspirations: Data Analysis and Probability
This is the transcript for the video of same title. Video contents: What are the two meanings of statistics? |
Data Analysis |
|
|
Video Transcript: Algebra Nspirations: Data Analysis and Probability, 1 |
Video Transcript: Algebra Nspirations: Data Analysis and Probability, Part 1
This is the transcript for the video of same title. |
Data Analysis |
|
|
Video Transcript: Algebra Nspirations: Data Analysis and Probability, 2 |
Video Transcript: Algebra Nspirations: Data Analysis and Probability, Part 2
This is the transcript for the video of same title. |
Data Analysis |
|
|
Video Transcript: TI-Nspire Mini-Tutorial: Graphing a Multiseries Scatterplot Using a Graphs and Geometry Window |
Video Transcript: TI-Nspire Mini-Tutorial: Graphing a Multiseries Scatterplot Using a Graphs and Geometry Window
This is the transcript for the TI-Nspire Mini-Tutorial entitled, Graphing a Multiseries Scatter |
Data Analysis |
|
|
Video Transcript: TI-Nspire Mini-Tutorial: Graphing a Scatterplot Using a Graphs and Geometry Window |
Video Transcript: TI-Nspire Mini-Tutorial: Graphing a Scatterplot Using a Graphs and Geometry Window
This is the transcript for the TI-Nspire Mini-Tutorial entitled, Graphing a Scatterplot Using a Graphs and |
Data Analysis |
|
|
Video Transcript: TI-Nspire Mini-Tutorial: Graphing a Scatterplot Using a Statistics Window |
Video Transcript: TI-Nspire Mini-Tutorial: Graphing a Scatterplot Using a Statistics Window
This is the transcript for the TI-Nspire Mini-Tutorial entitled, Graphing a Scatterplot Using a Statistics Window. |
Data Analysis |
|
|
VIDEO: Algebra Applications: Data Analysis |
VIDEO: Algebra Applications: Data Analysis
In this episode of Algebra Applications, students explore the dramatic events of 2008 related to the mortgage crisis. |
Data Analysis and Data Gathering |
|
|
VIDEO: Algebra Applications: Data Analysis, 1 |
VIDEO: Algebra Applications: Data Analysis, Segment 1: Introduction
In this introductory segment students learn about the mortage crisis of 2008. |
Data Analysis and Data Gathering |
|
|
VIDEO: Algebra Applications: Data Analysis, 2 |
VIDEO: Algebra Applications: Data Analysis, Segment 2: What Is a Mortgage?
The time value of money is at the basis of all loans. |
Data Analysis and Data Gathering |
|
|
VIDEO: Algebra Applications: Data Analysis, 3 |
VIDEO: Algebra Applications: Data Analysis, Segment 3: What Is a What is a Subprime Mortgage?
Having learned the general features of a mortgage, students learn the specifics of a subprime mortgage. |
Data Analysis and Data Gathering |
|
|
VIDEO: Algebra Applications: Data Analysis, 4 |
VIDEO: Algebra Applications: Data Analysis, Segment 4: What is an Adjustable Rate Mortgage?
Another factor in the mortgage crisis was the use of adjustable rate mortgages. |
Data Analysis and Data Gathering |
|
|
VIDEO: Algebra Nspirations: Data Analysis and Probability |
VIDEO: Algebra Nspirations: Data Analysis and Probability
What are the two meanings of statistics? What does it really mean that an event has a 50% probability of occurring? |
Data Analysis and Data Gathering |
|
|
VIDEO: Algebra Nspirations: Data Analysis and Probability, 1 |
VIDEO: Algebra Nspirations: Data Analysis and Probability, Segment 1
What are the two meanings of statistics? What does it really mean that an event has a 50% probability of occurring? |
Data Analysis and Data Gathering |
|
VIDEO: Algebra Nspirations: Data Analysis and Probability, 2 |
VIDEO: Algebra Nspirations: Data Analysis and Probability, Segment 2
What are the two meanings of statistics? What does it really mean that an event has a 50% probability of occurring? |
Data Analysis and Data Gathering |
|
|
VIDEO: Algebra Nspirations: Data Analysis and Probability, 3 |
VIDEO: Algebra Nspirations: Data Analysis and Probability, Segment 3
What are the two meanings of statistics? What does it really mean that an event has a 50% probability of occurring? |
Data Analysis and Data Gathering |
|
VIDEO: Algebra Nspirations: Data Analysis and Probability, 4 |
VIDEO: Algebra Nspirations: Data Analysis and Probability, Segment 4
What are the two meanings of statistics? What does it really mean that an event has a 50% probability of occurring? |
Data Analysis and Data Gathering |
|
Worksheet: TI-Nspire Mini-Tutorial: Graphing a Scatterplot Using a Graphs and Geometry Window |
Worksheet: TI-Nspire Mini-Tutorial: Graphing a Scatterplot Using a Graphs and Geometry Window
This is part of a collection of math worksheets on the use of the TI-Nspire graphing calculator. |
Data Analysis |
|
|
Worksheet: TI-Nspire Mini-Tutorial: Graphing a Scatterplot Using a Statistics Window |
Worksheet: TI-Nspire Mini-Tutorial: Graphing a Scatterplot Using a Statistics Window
This is part of a collection of math worksheets on the use of the TI-Nspire graphing calculator. |
Data Analysis |