Math Definitions Collection: Charts and Graphs
 |
OverviewThis collection aggregates all the definition image cards around the topic of Charts and Graphs. There are a total of 16 terms. |
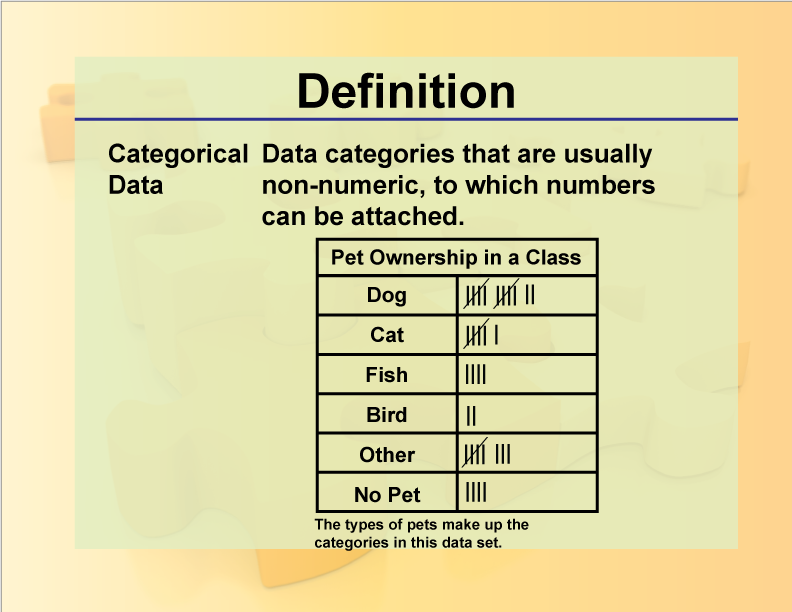
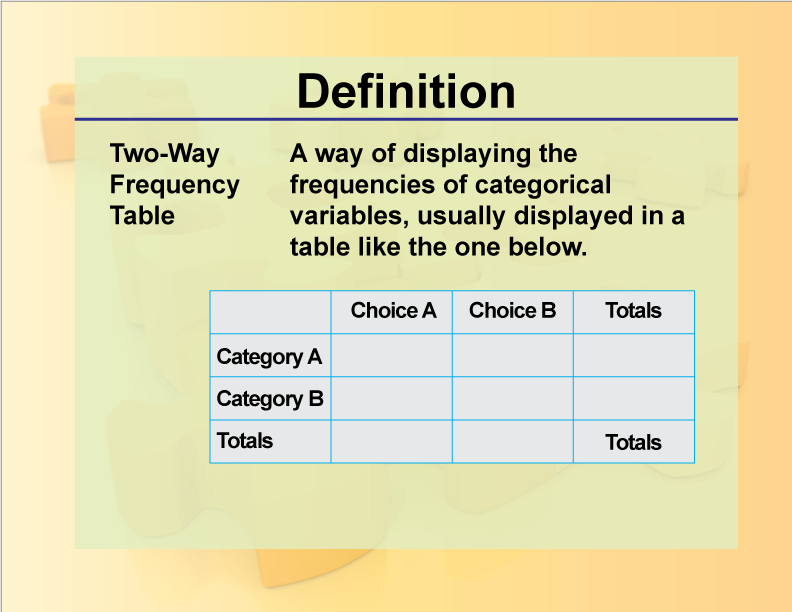
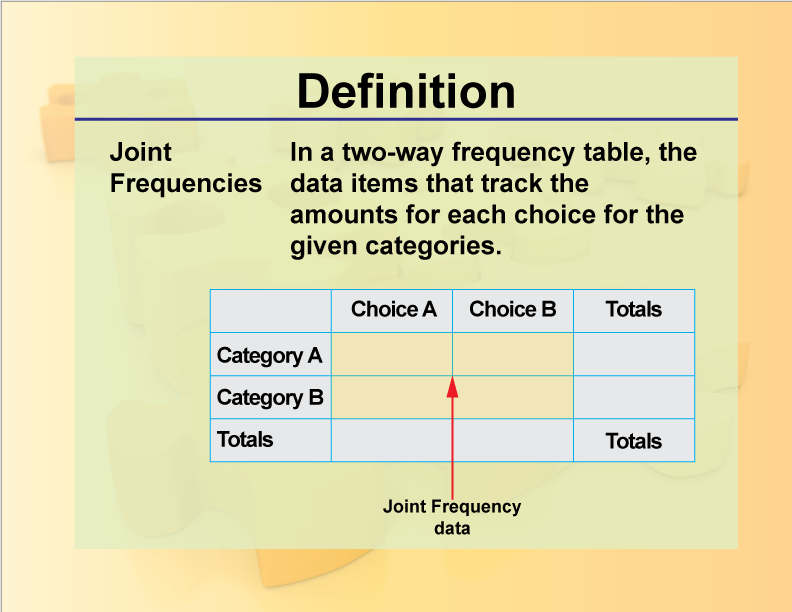
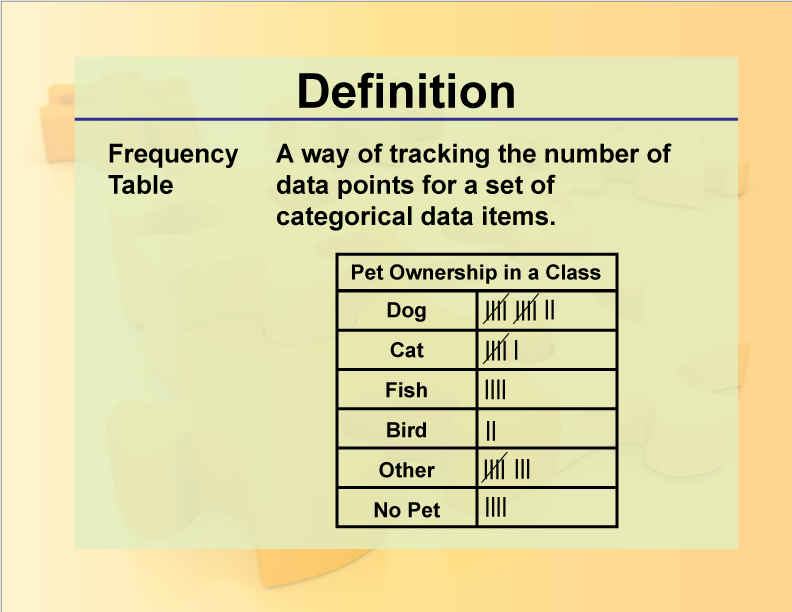
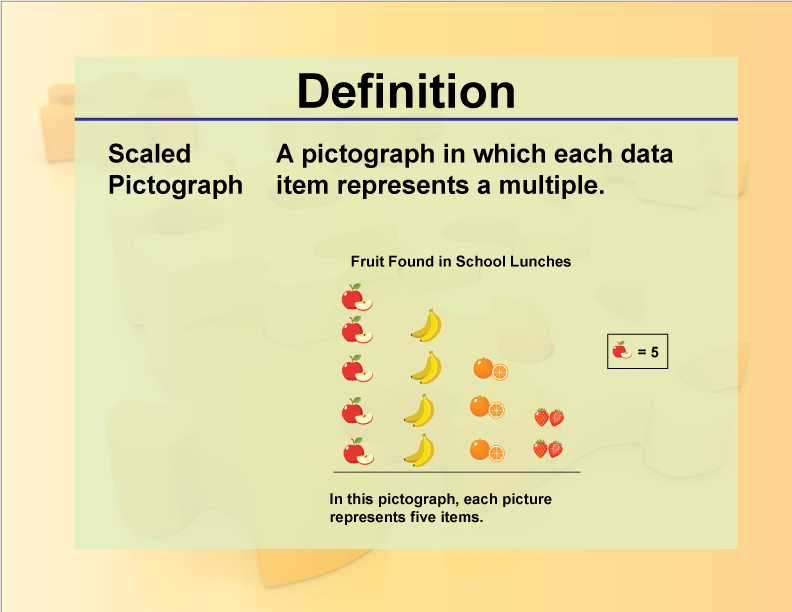
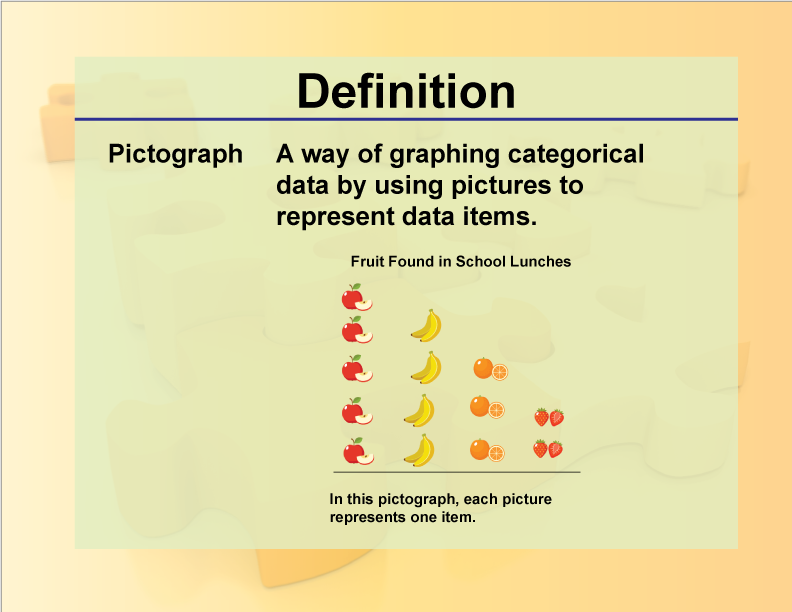
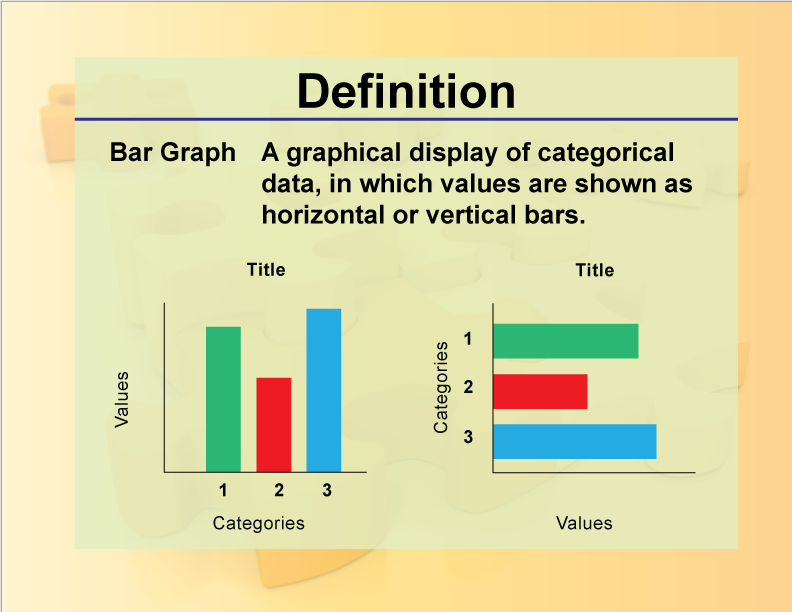
Summarize a data set with multiple categories using a frequency table, dot plot, pictograph, or bar graph with scaled intervals.
|
OverviewThis collection aggregates all the definition image cards around the topic of Charts and Graphs. There are a total of 16 terms. |