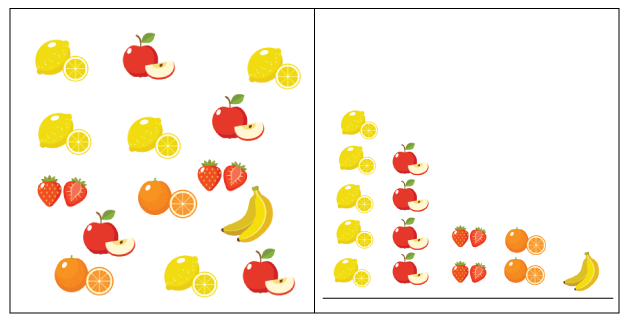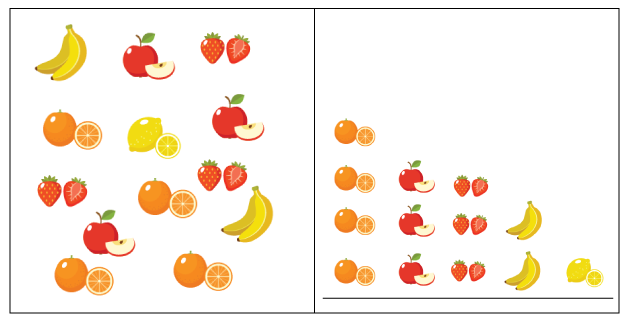
Analyze data represented in object graphs and picture graphs and communicate results: i) ask and answer questions about the data represented in object graphs and picture graphs (e.g., how many in each category, which categories have the greatest, least, or the same amount of data); and ii) draw conclusions about the data and make predictions based on the data.