
These are the resources that support this TEKS Standard.
TEKS.3.8B - Solve one- and two-step problems using categorical data represented with a frequency table, dot plot, pictograph, or bar graph with scaled intervals.
Displaying 1 - 41 of 41 resources:
| Thumbnail Image | Title | Description | Curriculum Nodes |
|---|---|---|---|
|
Math Clip Art Collection: Statistics |
This collection aggregates all the math clip art around the topic of Statistics. There are a total of 55 images. | Data Analysis, Probability, Data Gathering and Counting |
|
Math Definitions Collection: Charts and Graphs |
This collection aggregates all the definition image cards around the topic of Charts and Graphs. There are a total of 16 terms. | Data Analysis |
|
Math Worksheet Collection: Data Analysis |
This collection aggregates all the math worksheets around the topic of Data Analysis. There are a total of 9 worksheets. | Data Analysis |
|
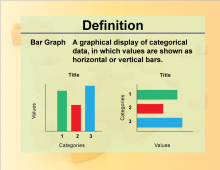
Definition--Charts and Graphs--Bar Graph |
Definition--Charts and Graphs--Bar Graph
This is a collection of definitions related to the concept of charts, graphs, and data displays. |
Data Analysis |
|
Definition--Charts and Graphs--Box-and-Whisker Plot |
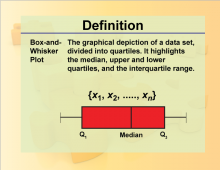
Definition--Charts and Graphs--Box-and-Whisker Plot
This is a collection of definitions related to the concept of charts, graphs, and data displays. |
Data Analysis |
|
Definition--Charts and Graphs--Categorical Data |
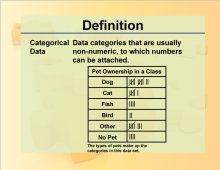
Definition--Charts and Graphs--Categorical Data
This is a collection of definitions related to the concept of charts, graphs, and data displays. |
Data Analysis |
|
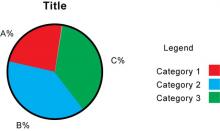
Definition--Charts and Graphs--Circle Graph |
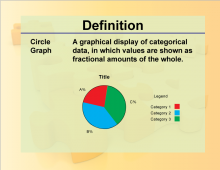
Definition--Charts and Graphs--Circle Graph
This is a collection of definitions related to the concept of charts, graphs, and data displays. |
Data Analysis |
|
Definition--Charts and Graphs--Continuous Data |
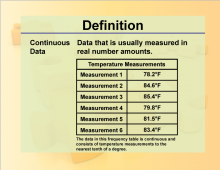
Definition--Charts and Graphs--Continuous Data
This is a collection of definitions related to the concept of charts, graphs, and data displays. |
Data Analysis |
|
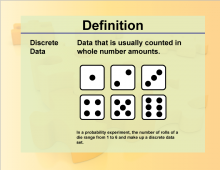
Definition--Charts and Graphs--Discrete Data |
Definition--Charts and Graphs--Discrete Data
This is a collection of definitions related to the concept of charts, graphs, and data displays. |
Data Analysis |
|
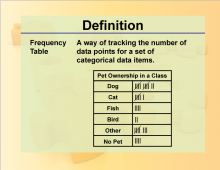
Definition--Charts and Graphs--Frequency Table |
Definition--Charts and Graphs--Frequency Table
This is a collection of definitions related to the concept of charts, graphs, and data displays. |
Data Analysis |
|
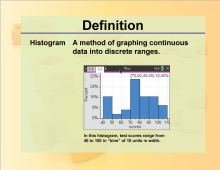
Definition--Charts and Graphs--Histogram |
Definition--Charts and Graphs--Histogram
This is a collection of definitions related to the concept of charts, graphs, and data displays. |
Data Analysis |
|
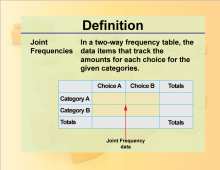
Definition--Charts and Graphs--Joint Frequencies |
Definition--Charts and Graphs--Joint Frequencies
This is a collection of definitions related to the concept of charts, graphs, and data displays. |
Data Analysis |
|
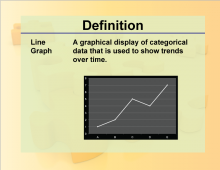
Definition--Charts and Graphs--Line Graph |
Definition--Charts and Graphs--Line Graph
This is a collection of definitions related to the concept of charts, graphs, and data displays. |
Data Analysis |
|
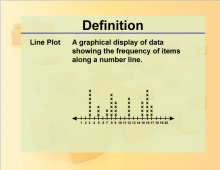
Definition--Charts and Graphs--Line Plot |
Definition--Charts and Graphs--Line Plot
This is a collection of definitions related to the concept of charts, graphs, and data displays. |
Data Analysis |
|
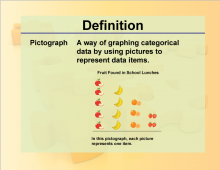
Definition--Charts and Graphs--Pictograph |
Definition--Charts and Graphs--Pictograph
This is a collection of definitions related to the concept of charts, graphs, and data displays. |
Data Analysis |
|
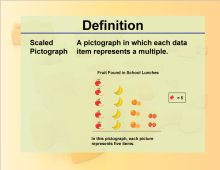
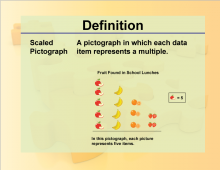
Definition--Charts and Graphs--Scaled Pictograph |
Definition--Charts and Graphs--Scaled Pictograph
This is a collection of definitions related to the concept of charts, graphs, and data displays. |
Data Analysis |
|
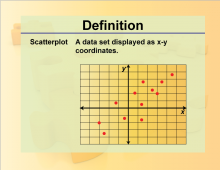
Definition--Charts and Graphs--Scatterplot |
Definition--Charts and Graphs--Scatterplot
This is a collection of definitions related to the concept of charts, graphs, and data displays. |
Data Analysis |
|
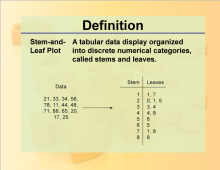
Definition--Charts and Graphs--Stem-and-Leaf Plot |
Definition--Charts and Graphs--Stem-and-Leaf Plot
This is a collection of definitions related to the concept of charts, graphs, and data displays. |
Data Analysis |
|
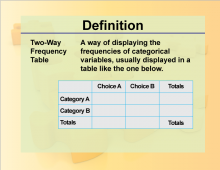
Definition--Charts and Graphs--Two-Way Frequency Table |
Definition--Charts and Graphs--Two-Way Frequency Table
This is a collection of definitions related to the concept of charts, graphs, and data displays. |
Data Analysis |

|
Math Clip Art--Statistics and Probability--Basic Line Plot |
Math Clip Art--Statistics and Probability--Basic Line Plot
This is part of a collection of math clip art images that show different statistical graphs and concepts, along with some probability concepts. |
Length |
|
Math Clip Art--Statistics and Probability--Circle Graph |
Math Clip Art--Statistics and Probability--Circle Graph
This is part of a collection of math clip art images that show different statistical graphs and concepts, along with some probability concepts. |
Data Analysis |
|
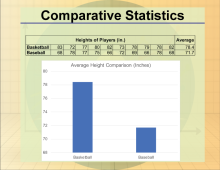
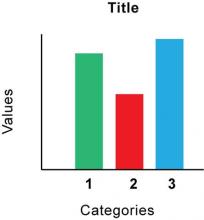
Math Clip Art--Statistics--Bar Graph |
Math Clip Art--Statistics--Bar Graph
This is part of a collection of math clip art images that show different statistical graphs and concepts, along with some probability concepts. |
Data Analysis |
|
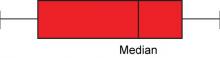
Math Clip Art--Statistics--Box and Whisker Plot |
Math Clip Art--Statistics--Box and Whisker Plot
This is part of a collection of math clip art images that show different statistical graphs and concepts, along with some probability concepts. |
Data Analysis |
|
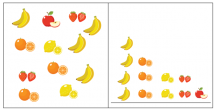
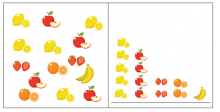
Math Clip Art--Statistics--Fruit Pictograph-1 |
Math Clip Art--Statistics--Fruit Pictograph-1
This is part of a collection of math clip art images that show different statistical graphs and concepts, along with some probability concepts. |
Counting |
|
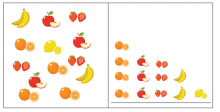
Math Clip Art--Statistics--Fruit Pictograph-2 |
Math Clip Art--Statistics--Fruit Pictograph-2
This is part of a collection of math clip art images that show different statistical graphs and concepts, along with some probability concepts. |
Counting |
|
Math Clip Art--Statistics--Fruit Pictograph-3 |
Math Clip Art--Statistics--Fruit Pictograph-3
This is part of a collection of math clip art images that show different statistical graphs and concepts, along with some probability concepts. |
Counting |
|
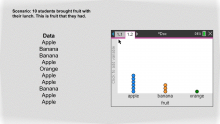
Math Clip Art--Statistics--Line Plots with Data--01 |
Math Clip Art--Statistics--Line Plots with Data--01
This is part of a collection of math clip art images that show different statistical graphs and concepts, along with some probability concepts. |
Data Analysis |
|
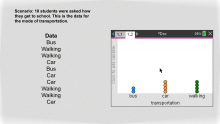
Math Clip Art--Statistics--Line Plots with Data--02 |
Math Clip Art--Statistics--Line Plots with Data--02
This is part of a collection of math clip art images that show different statistical graphs and concepts, along with some probability concepts. |
Data Analysis |
|
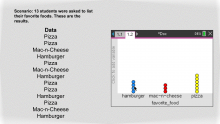
Math Clip Art--Statistics--Line Plots with Data--03 |
Math Clip Art--Statistics--Line Plots with Data--03
This is part of a collection of math clip art images that show different statistical graphs and concepts, along with some probability concepts. |
Data Analysis |
|
Math Clip Art--Statistics--Line Plots with Data--04 |
Math Clip Art--Statistics--Line Plots with Data--04
This is part of a collection of math clip art images that show different statistical graphs and concepts, along with some probability concepts. |
Data Analysis |
|
Math Clip Art--Statistics--Line Plots with Data--05 |
Math Clip Art--Statistics--Line Plots with Data--05
This is part of a collection of math clip art images that show different statistical graphs and concepts, along with some probability concepts. |
Data Analysis |
|
Math Clip Art--Statistics--Line Plots with Data--06 |
Math Clip Art--Statistics--Line Plots with Data--06
This is part of a collection of math clip art images that show different statistical graphs and concepts, along with some probability concepts. |
Data Analysis |
|
Math Clip Art--Statistics--Line Plots with Data--07 |
Math Clip Art--Statistics--Line Plots with Data--07
This is part of a collection of math clip art images that show different statistical graphs and concepts, along with some probability concepts. |
Data Analysis |
|
Math Clip Art--Statistics--Line Plots with Data--08 |
Math Clip Art--Statistics--Line Plots with Data--08
This is part of a collection of math clip art images that show different statistical graphs and concepts, along with some probability concepts. |
Data Analysis |
|
Math Clip Art--Statistics--Line Plots with Data--09 |
Math Clip Art--Statistics--Line Plots with Data--09
This is part of a collection of math clip art images that show different statistical graphs and concepts, along with some probability concepts. |
Data Analysis |
|
Math Clip Art--Statistics--Line Plots with Data--10 |
Math Clip Art--Statistics--Line Plots with Data--10
This is part of a collection of math clip art images that show different statistical graphs and concepts, along with some probability concepts. |
Data Analysis |
|
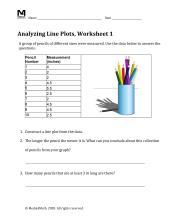
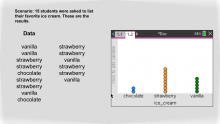
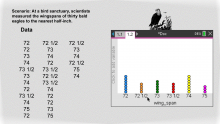
Worksheet: Analyzing Line Plots, Worksheet 1 |
Worksheet: Analyzing Line Plots, Worksheet 1
This is part of a collection of math worksheets on the topic of constructing and analyzing line plots from a given data set. |
Data Analysis |
|
|
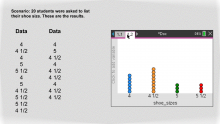
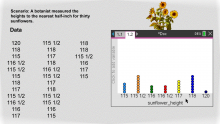
Worksheet: Analyzing Line Plots, Worksheet 2 |
Worksheet: Analyzing Line Plots, Worksheet 2
This is part of a collection of math worksheets on the topic of constructing and analyzing line plots from a given data set. |
Data Analysis |
|
|
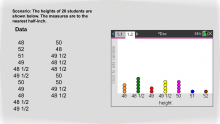
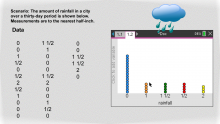
Worksheet: Analyzing Line Plots, Worksheet 3 |
Worksheet: Analyzing Line Plots, Worksheet 3
This is part of a collection of math worksheets on the topic of constructing and analyzing line plots from a given data set. |
Data Analysis |
|
|
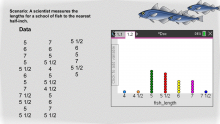
Worksheet: Analyzing Line Plots, Worksheet 4 |
Worksheet: Analyzing Line Plots, Worksheet 4
This is part of a collection of math worksheets on the topic of constructing and analyzing line plots from a given data set. |
Data Analysis |
|
|
Worksheet: Analyzing Line Plots, Worksheet 5 |
Worksheet: Analyzing Line Plots, Worksheet 5
This is part of a collection of math worksheets on the topic of constructing and analyzing line plots from a given data set. |
Data Analysis |