
These are the resources that support this TEKS Standard.
TEKS.7.7 -
Displaying 1 - 50 of 51 resources:
| Thumbnail Image | Title | Description | Curriculum Nodes |
|---|---|---|---|
|
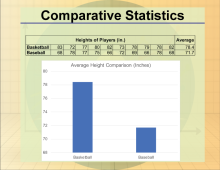
Math Clip Art Collection: Statistics |
This collection aggregates all the math clip art around the topic of Statistics. There are a total of 55 images. | Data Analysis, Probability, Data Gathering and Counting |
|
Math Definitions Collection: Charts and Graphs |
This collection aggregates all the definition image cards around the topic of Charts and Graphs. There are a total of 16 terms. | Data Analysis |
|
Math Video Collection: Texas Instruments Tutorial Videos |
This collection aggregates all the math videos and resources in this series: Texas Instruments Tutorial Videos. There are a total of 266 resources. | Rational Expressions, Sequences, Series, Polynomial Functions and Equations, Graphs of Quadratic Functions, Quadratic Equations and Functions, Solving Systems of Equations, Trig Expressions and Identities, Probability, Geometric Constructions with Triangles, Composite Functions, Geometric Constructions with Angles and Planes, Distance Formula, Data Analysis, Slope, Special Functions, Trigonometric Functions, Graphs of Exponential and Logarithmic Functions, Radical Functions and Equations, Rational Functions and Equations, Slope-Intercept Form, Coordinate Systems, Graphs of Linear Functions, Inequalities, Matrix Operations and Midpoint Formula |
|
Closed Captioned Video: Box-and-Whisker Plot |
Closed Captioned Video: Box-and-Whisker Plot
In this TI Nspire tutorial the Spreadsheet and Statistics windows are used to create a box-and-whisker plot. |
Data Analysis |
|
Closed Captioned Video: Multiseries Scatterplot |
Closed Captioned Video: Multiseries Scatterplot
In this TI Nspire tutorial, Spreadsheet and Graph windows are used to graph a multiseries scatterplot. This video supports the TI-Nspire Clickpad and Touchpad. |
Data Analysis |
|
Closed Captioned Video: Scatterplot 1 |
Closed Captioned Video: Scatterplot 1
In this TI Nspire tutorial, Spreadsheet and Graph windows are used to graph a scatterplot. This video supports the TI-Nspire Clickpad and Touchpad. |
Data Analysis |
|
Closed Captioned Video: Scatterplot 2 |
Closed Captioned Video: Scatterplot 2
In this TI Nspire tutorial, Spreadsheet and Statistics windows are used to graph a scatterplot. This video supports the TI-Nspire Clickpad and Touchpad. |
Data Analysis |
|
Closed Captioned Video: Creating a Histogram |
Closed Captioned Video: Creating a Histogram
In this TI Nspire tutorial, the Spreadsheet and Statistics windows are used to create a histogram. This video supports the TI-Nspire Clickpad and Touchpad. |
Data Analysis |
|
Closed Captioned Video: Random Number Table |
Closed Captioned Video: Random Number Table
In this TI Nspire tutorial, the Spreadsheet window is used to create a random number table. This video supports the TI-Nspire Clickpad and Touchpad. |
Probability |
|
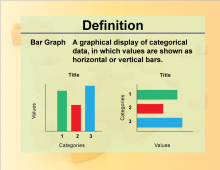
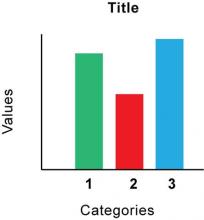
Definition--Charts and Graphs--Bar Graph |
Definition--Charts and Graphs--Bar Graph
This is a collection of definitions related to the concept of charts, graphs, and data displays. |
Data Analysis |
|
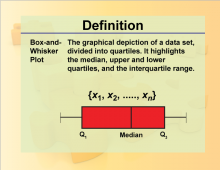
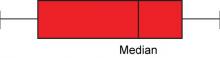
Definition--Charts and Graphs--Box-and-Whisker Plot |
Definition--Charts and Graphs--Box-and-Whisker Plot
This is a collection of definitions related to the concept of charts, graphs, and data displays. |
Data Analysis |
|
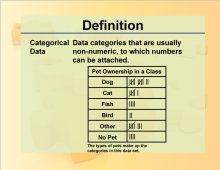
Definition--Charts and Graphs--Categorical Data |
Definition--Charts and Graphs--Categorical Data
This is a collection of definitions related to the concept of charts, graphs, and data displays. |
Data Analysis |
|
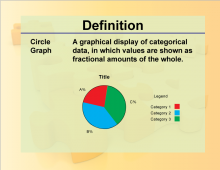
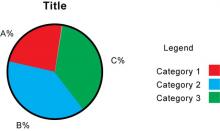
Definition--Charts and Graphs--Circle Graph |
Definition--Charts and Graphs--Circle Graph
This is a collection of definitions related to the concept of charts, graphs, and data displays. |
Data Analysis |
|
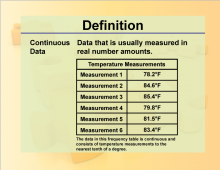
Definition--Charts and Graphs--Continuous Data |
Definition--Charts and Graphs--Continuous Data
This is a collection of definitions related to the concept of charts, graphs, and data displays. |
Data Analysis |
|
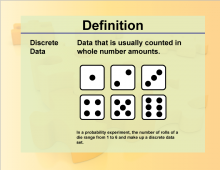
Definition--Charts and Graphs--Discrete Data |
Definition--Charts and Graphs--Discrete Data
This is a collection of definitions related to the concept of charts, graphs, and data displays. |
Data Analysis |
|
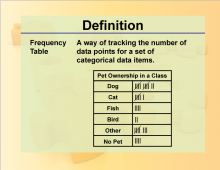
Definition--Charts and Graphs--Frequency Table |
Definition--Charts and Graphs--Frequency Table
This is a collection of definitions related to the concept of charts, graphs, and data displays. |
Data Analysis |
|
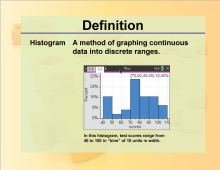
Definition--Charts and Graphs--Histogram |
Definition--Charts and Graphs--Histogram
This is a collection of definitions related to the concept of charts, graphs, and data displays. |
Data Analysis |
|
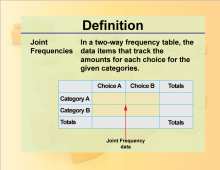
Definition--Charts and Graphs--Joint Frequencies |
Definition--Charts and Graphs--Joint Frequencies
This is a collection of definitions related to the concept of charts, graphs, and data displays. |
Data Analysis |
|
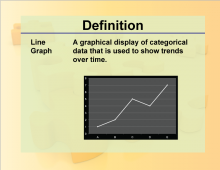
Definition--Charts and Graphs--Line Graph |
Definition--Charts and Graphs--Line Graph
This is a collection of definitions related to the concept of charts, graphs, and data displays. |
Data Analysis |
|
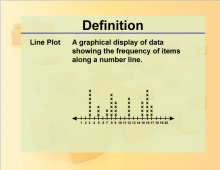
Definition--Charts and Graphs--Line Plot |
Definition--Charts and Graphs--Line Plot
This is a collection of definitions related to the concept of charts, graphs, and data displays. |
Data Analysis |
|
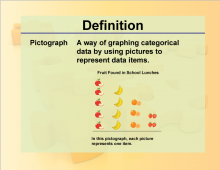
Definition--Charts and Graphs--Pictograph |
Definition--Charts and Graphs--Pictograph
This is a collection of definitions related to the concept of charts, graphs, and data displays. |
Data Analysis |
|
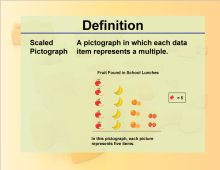
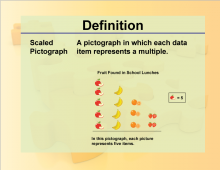
Definition--Charts and Graphs--Scaled Pictograph |
Definition--Charts and Graphs--Scaled Pictograph
This is a collection of definitions related to the concept of charts, graphs, and data displays. |
Data Analysis |
|
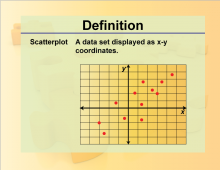
Definition--Charts and Graphs--Scatterplot |
Definition--Charts and Graphs--Scatterplot
This is a collection of definitions related to the concept of charts, graphs, and data displays. |
Data Analysis |
|
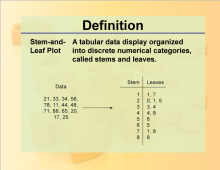
Definition--Charts and Graphs--Stem-and-Leaf Plot |
Definition--Charts and Graphs--Stem-and-Leaf Plot
This is a collection of definitions related to the concept of charts, graphs, and data displays. |
Data Analysis |
|
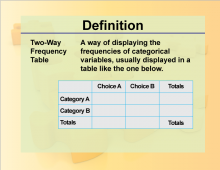
Definition--Charts and Graphs--Two-Way Frequency Table |
Definition--Charts and Graphs--Two-Way Frequency Table
This is a collection of definitions related to the concept of charts, graphs, and data displays. |
Data Analysis |

|
Math Clip Art--Statistics and Probability--Basic Line Plot |
Math Clip Art--Statistics and Probability--Basic Line Plot
This is part of a collection of math clip art images that show different statistical graphs and concepts, along with some probability concepts. |
Length |
|
Math Clip Art--Statistics and Probability--Circle Graph |
Math Clip Art--Statistics and Probability--Circle Graph
This is part of a collection of math clip art images that show different statistical graphs and concepts, along with some probability concepts. |
Data Analysis |
|
Math Clip Art--Statistics--Bar Graph |
Math Clip Art--Statistics--Bar Graph
This is part of a collection of math clip art images that show different statistical graphs and concepts, along with some probability concepts. |
Data Analysis |
|
Math Clip Art--Statistics--Box and Whisker Plot |
Math Clip Art--Statistics--Box and Whisker Plot
This is part of a collection of math clip art images that show different statistical graphs and concepts, along with some probability concepts. |
Data Analysis |
|
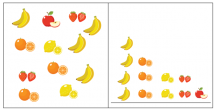
Math Clip Art--Statistics--Fruit Pictograph-1 |
Math Clip Art--Statistics--Fruit Pictograph-1
This is part of a collection of math clip art images that show different statistical graphs and concepts, along with some probability concepts. |
Counting |
|
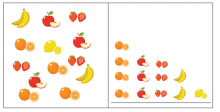
Math Clip Art--Statistics--Fruit Pictograph-2 |
Math Clip Art--Statistics--Fruit Pictograph-2
This is part of a collection of math clip art images that show different statistical graphs and concepts, along with some probability concepts. |
Counting |
|
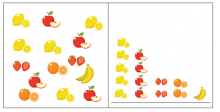
Math Clip Art--Statistics--Fruit Pictograph-3 |
Math Clip Art--Statistics--Fruit Pictograph-3
This is part of a collection of math clip art images that show different statistical graphs and concepts, along with some probability concepts. |
Counting |
|
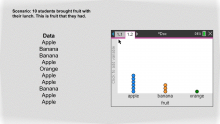
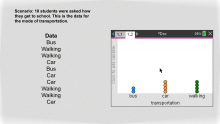
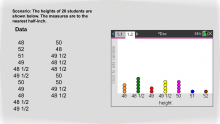
Math Clip Art--Statistics--Line Plots with Data--01 |
Math Clip Art--Statistics--Line Plots with Data--01
This is part of a collection of math clip art images that show different statistical graphs and concepts, along with some probability concepts. |
Data Analysis |
|
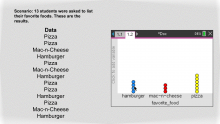
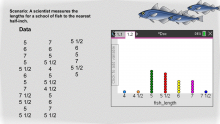
Math Clip Art--Statistics--Line Plots with Data--02 |
Math Clip Art--Statistics--Line Plots with Data--02
This is part of a collection of math clip art images that show different statistical graphs and concepts, along with some probability concepts. |
Data Analysis |
|
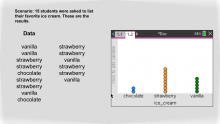
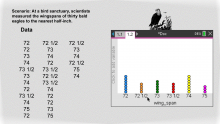
Math Clip Art--Statistics--Line Plots with Data--03 |
Math Clip Art--Statistics--Line Plots with Data--03
This is part of a collection of math clip art images that show different statistical graphs and concepts, along with some probability concepts. |
Data Analysis |
|
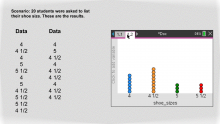
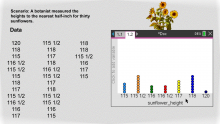
Math Clip Art--Statistics--Line Plots with Data--04 |
Math Clip Art--Statistics--Line Plots with Data--04
This is part of a collection of math clip art images that show different statistical graphs and concepts, along with some probability concepts. |
Data Analysis |
|
Math Clip Art--Statistics--Line Plots with Data--05 |
Math Clip Art--Statistics--Line Plots with Data--05
This is part of a collection of math clip art images that show different statistical graphs and concepts, along with some probability concepts. |
Data Analysis |
|
Math Clip Art--Statistics--Line Plots with Data--06 |
Math Clip Art--Statistics--Line Plots with Data--06
This is part of a collection of math clip art images that show different statistical graphs and concepts, along with some probability concepts. |
Data Analysis |
|
Math Clip Art--Statistics--Line Plots with Data--07 |
Math Clip Art--Statistics--Line Plots with Data--07
This is part of a collection of math clip art images that show different statistical graphs and concepts, along with some probability concepts. |
Data Analysis |
|
Math Clip Art--Statistics--Line Plots with Data--08 |
Math Clip Art--Statistics--Line Plots with Data--08
This is part of a collection of math clip art images that show different statistical graphs and concepts, along with some probability concepts. |
Data Analysis |
|
Math Clip Art--Statistics--Line Plots with Data--09 |
Math Clip Art--Statistics--Line Plots with Data--09
This is part of a collection of math clip art images that show different statistical graphs and concepts, along with some probability concepts. |
Data Analysis |
|
Math Clip Art--Statistics--Line Plots with Data--10 |
Math Clip Art--Statistics--Line Plots with Data--10
This is part of a collection of math clip art images that show different statistical graphs and concepts, along with some probability concepts. |
Data Analysis |

|
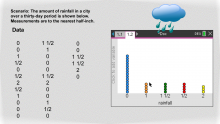
Video Transcript: TI-Nspire Mini-Tutorial: Creating a Histogram |
Video Transcript: TI-Nspire Mini-Tutorial: Creating a Histogram
This is the transcript for the TI-Nspire Mini-Tutorial entitled, Creating a Histogram. |
Data Analysis |
|
|
Video Transcript: TI-Nspire Mini-Tutorial: Creating a Random Number Table |
Video Transcript: TI-Nspire Mini-Tutorial: Creating a Random Number Table
This is the transcript for the TI-Nspire Mini-Tutorial entitled, Creating a Random Number Table. |
Probability |
|
|
VIDEO: Ti-Nspire Mini-Tutorial, Video 55 |
VIDEO: TI-Nspire Mini-Tutorial: Creating a Random Number Table
In this TI Nspire tutorial, the Spreadsheet window is used to create a random number table. |
Probability |
|
Worksheet: TI-Nspire Mini-Tutorial: Creating a Histogram |
Worksheet: TI-Nspire Mini-Tutorial: Creating a Histogram
This is part of a collection of math worksheets on the use of the TI-Nspire graphing calculator. |
Data Analysis |
|
|
Worksheet: TI-Nspire Mini-Tutorial: Creating a Random Number Table |
Worksheet: TI-Nspire Mini-Tutorial: Creating a Random Number Table
This is part of a collection of math worksheets on the use of the TI-Nspire graphing calculator. |
Probability |
|
|
Worksheet: TI-Nspire Mini-Tutorial: Graphing a Box-and-Whisker Plot |
Worksheet: TI-Nspire Mini-Tutorial: Graphing a Box-and-Whisker Plot
This is part of a collection of math worksheets on the use of the TI-Nspire graphing calculator. |
Data Analysis |
|
Worksheet: TI-Nspire Mini-Tutorial: Graphing a Multiseries Scatterplot Using a Graphs and Geometry Window |
Worksheet: TI-Nspire Mini-Tutorial: Graphing a Multiseries Scatterplot Using a Graphs and Geometry Window
This is part of a collection of math worksheets on the use of the TI-Nspire graphing calculator. |
Data Analysis |
|
|
Worksheet: TI-Nspire Mini-Tutorial: Graphing a Scatterplot Using a Graphs and Geometry Window |
Worksheet: TI-Nspire Mini-Tutorial: Graphing a Scatterplot Using a Graphs and Geometry Window
This is part of a collection of math worksheets on the use of the TI-Nspire graphing calculator. |
Data Analysis |