These are the resources that support this Florida Standard.
MAFS.912.S-ID.1.1: Represent data with plots on the real number line (dot plots, histograms, and box plots).
There are 95 resources.| Title | Description | Thumbnail Image | Curriculum Topics |
|---|---|---|---|
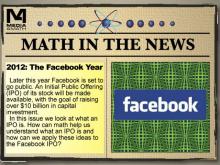
Math in the News: Issue 41--2012: The Facebook Year |
Math in the News: Issue 41--2012: The Facebook YearJanuary 2012. In this issue of Math in the News we look at the Facebook IPO. |
|
Data Analysis |
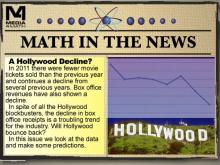
Math in the News: Issue 43--A Hollywood Decline? |
Math in the News: Issue 43--A Hollywood Decline?January 2012. In this issue of Math in the News, we look at box office data from 2011. |
|
Data Analysis |
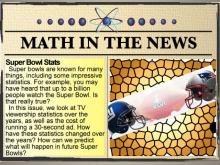
Math in the News: Issue 45--Super Bowl Stats |
Math in the News: Issue 45--Super Bowl StatsFebruary 2012. In this issue of Math in the News we look at stats from Super Bowls past. |
|
Data Analysis |
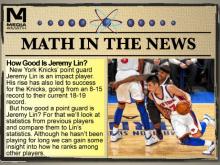
Math in the News: Issue 48--How Good Is Jeremy Lin? |
Math in the News: Issue 48--How Good Is Jeremy Lin?February 2012. In this issue of Math in the News, we look at basketball statistics, in particular the stats for Jeremy Lin. |
|
Data Analysis |
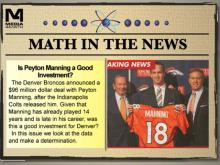
Math in the News: Issue 51--Peyton Manning |
Math in the News: Issue 51--Is Peyton Manning a Good Investment?March 2012. In this issue of Math in the News we look at Peyton Manning's new contract with the Denver Broncos. Was this a good deal or not? |
|
Data Analysis |
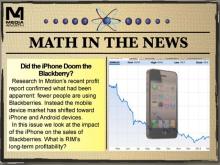
Math in the News: Issue 52--The iPhone |
Math in the News: Issue 52--Did the iPhone Doom the Blackberry?April 2012. In this issue of Math in the News we look at the future of Research in Motion's Blackberry, in light of the rise of the iPhone and Android devices. |
|
Data Analysis |
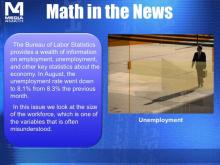
Math in the News: Issue 60--Unemployment |
Math in the News: Issue 60--UnemploymentSeptember 2012. In this issue we look at August 2012 unemployment statistics. |
|
Data Analysis |
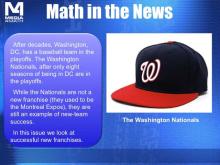
Math in the News: Issue 62--The Washington Nationals |
Math in the News: Issue 62--The Washington NationalsSeptember 2012. In this issue of Math in the News we look at the remarkable success of the Washington Nationals baseball team. In the process we look at the success of new baseball franchises and why this happens. |
|
Data Analysis |
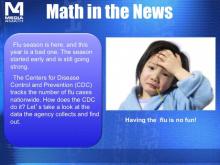
Math in the News: Issue 68--Flu Season |
Math in the News: Issue 68--Flu SeasonFebruary 2013. In this issue of Math in the News, we look at statistics for the flu season. |
|
Data Analysis |
Math in the News: Issue 69--The Russian Meteorite |
Math in the News: Issue 69--The Russian MeteoriteFebruary 2013. In this issue of Math in the News we look at statistics related to Russian meteor that recently crash-landed. Watch some compelling eyewitness video and explore how the path of meteor was reconstructed. |

|
Data Analysis |
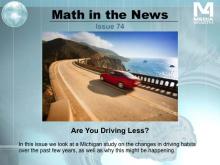
Math in the News: Issue 74--Are You Driving Less? |
Math in the News: Issue 74--Are You Driving Less?August 2013. In this issue we look at the University of Michigan Study on American driving habts. The results show that Americans are driving less. But why is this? We look at the data and draw some conclusion. |
|
Data Analysis |
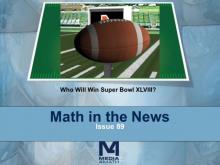
Math in the News: Issue 89--Who Will Win Super Bowl XLVIII? |
Math in the News: Issue 89--Who Will Win Super Bowl XLVIII?January 2014. In this issue of Math in the News we look at football statistics to examine who stands the best chance of winning Super Bowl XLVIII. This is an excellent opportunity for data analysis. |
|
Data Analysis |
Video Transcript: TI-Nspire Mini-Tutorial: A Probability Simulation of Rolling Two Dice Multiple Times (with Histogram) |
Video Transcript: TI-Nspire Mini-Tutorial: A Probability Simulation of Rolling Two Dice Multiple Times (with Histogram)This is the transcript for the TI-Nspire Mini-Tutorial entitled, A Probability Simulation of Rolling Two Dice Multiple Times (with Histogram). |

|
Probability |
Video Transcript: TI-Nspire Mini-Tutorial: Creating a Histogram |
Video Transcript: TI-Nspire Mini-Tutorial: Creating a HistogramThis is the transcript for the TI-Nspire Mini-Tutorial entitled, Creating a Histogram. |
|
Data Analysis |
Video Transcript: TI-Nspire Mini-Tutorial: Graphing a Box-and-Whisker Plot |
Video Transcript: TI-Nspire Mini-Tutorial: Graphing a Box-and-Whisker PlotThis is the transcript for the TI-Nspire Mini-Tutorial entitled, Graphing a Box-and-Whisker Plot. |
|
Data Analysis |
VIDEO: Ti-Nspire Mini-Tutorial, Video 35 |
VIDEO: TI-Nspire Mini-Tutorial: A Probability Simulation of Rolling Two Dice Multiple Times (with Histogram)In this TI Nspire tutorialthe Spreadsheet and Statistics windows are used to create a probability simulation of tossing two dice. This video supports the TI-Nspire Clickpad and Touchpad. |
|
Probability |
VIDEO: Ti-Nspire Mini-Tutorial, Video 54 |
VIDEO: TI-Nspire Mini-Tutorial: Creating a HistogramIn this TI Nspire tutorial, the Spreadsheet and Statistics windows are used to create a histogram. This video supports the TI-Nspire Clickpad and Touchpad. |
|
Data Analysis |
VIDEO: Ti-Nspire Mini-Tutorial, Video 76 |
VIDEO: TI-Nspire Mini-Tutorial: Graphing a Box-and-Whisker PlotIn this TI Nspire tutorial the Spreadsheet and Statistics windows are used to create a box-and-whisker plot. This video supports the TI-Nspire Clickpad and Touchpad. |
|
Data Analysis |
Worksheet: TI-Nspire Mini-Tutorial: A Probability Simulation of Rolling Two Dice Multiple Times (with Histogram) |
Worksheet: TI-Nspire Mini-Tutorial: A Probability Simulation of Rolling Two Dice Multiple Times (with Histogram)This is part of a collection of math worksheets on the use of the TI-Nspire graphing calculator. Each worksheet supports a companion TI-Nspire Mini-Tutorial video. It provides all the keystrokes for the activity. |
|
Probability |
Worksheet: TI-Nspire Mini-Tutorial: Graphing a Box-and-Whisker Plot |
Worksheet: TI-Nspire Mini-Tutorial: Graphing a Box-and-Whisker PlotThis is part of a collection of math worksheets on the use of the TI-Nspire graphing calculator. Each worksheet supports a companion TI-Nspire Mini-Tutorial video. It provides all the keystrokes for the activity. |
|
Data Analysis |
Join the hundreds of thousands of math educators who have used Media4Math resources in their classroom to engage their students. Our new integrated Library/Classroom product has everything you need!
About Media4Math
Our Mission
Media4Math's mission is to educate 21st-century students in real-world applications of math with digital technology. We bring math to life in your classroom with a rich blend of resources to inspire your students to learn. Our philosophy is that the procedural side of math is a prerequisite to using it, but we also find that real-world math applications can provide motivation and even inspiration for math students. Math is its own language and it has important stories to tell. While many of our resources are for procedural skills, there are many resources that are real-world applications of math. Some of these resources rely on partnerships with other educational publishers.
About Media4Math Library
Media4Math Library contains over 15,000 high-quality resources designed for classroom or home use. This includes instructional, remediation, and assessment resources. You'll find truly innovative resources that bring math to life. Resources in Media4Math Library include:
- Videos
- Math Clip Art
- Math Examples
- Quizzes
- Tutorials
- PowerPoint and Google Slide presentations
- GoogleEarth Voyager Stories
- Algebra Applications
- Geometry Explorations
- Quizlet Flash Cards
- Desmos Resources
- Texas Instrument Resources
- Games and Simulations
About Media4Math Classroom
Media4Math Classroom provides ready-to-use interactive math lessons that teach, assess, and provide real-world applications of topics in Pre-Algebra, Algebra, and Geometry. Assign these modules to your students and capture assessment scores in an easy-to-use Dashboard. This is a growing library of instructional modules. Topics include:
- Arithmetic
- Pre-Algebra
- Algebra
- Geometry
- SAT Math Prep
Media4Math Classroom modules provide real world applications of math that will motivate your students. Here are some examples:
- Construction Site Math. Apply ratios and proportions to mixtures of cement and concrete. This module includes video resources and your students will get a real-world application of ratios and proportions.
- Counting Bison. Apply place value concepts to the real-world application of the bison population. Because the bison population has gone through dramatic changes in population, this become an opportunity to use and apply place value.
- Wildlife Refuge. This study of area and perimeter centers on the mustang population in the Nevada area. Students explore the relationship between area and perimeter of rectangular shapes in the context of designing a wildlife refuge.
The Media4Math Bundle
A subscription to the Media4Math bundle gives teachers access to all the resources listed above. Specifically:
- Access to all the Media4Math Library resources and tools.
- Access to all the Media4Math Classroom instructional modules.
To learn more about our subscription packages, contact us at admin@media4math.com.
Partnering with Media4Math
Media4Math prides itself on its strategic partnerships with other educational organizations. Our partnerships include the following partners:
-
Google Earth. Media4Math has partnered with GoogleEarth to create a comprehensive library of GoogleEarth Voyager Stories. These map-based explorations of geometry, geography, and culture will literally bring the math to life. See our collection of Voyager Stories by clicking on this link to the Google Earth resources.
-
Texas Instruments. TI is the leading provider of graphing calculators used in the classroom. Media4Math has partnered with TI to create a library of digital resources to support the use of these graphing calculators. These resources include videos, presentations, and related tutorials. See our collection of TI resources by clicking on this link to the TI resources.
-
Desmos. This free online resource that includes a graphing calculator and geometry tools. Media4Math has created an extensive library of resources that support the use of these Desmos resources. See our collection of Desmos resources by clicking on this link to the Desmos resources.
- Quizlet. We have partnered with the leading provider of interactive Flash Cards and is used by millions of teachers and students around the world. Media4Math has developed an extensive library of Quizlet resources. See our collection of Quizlet resources by clicking on this link to the Quizlet resources.
Link to the Media4Math Study Sets on Quizlet and search for "Media4Math."
- The Princeton Review. The Princeton Review is the leading provider of SAT prep and other test preparation courses and tutorials. Media4Math is an affiliate of Princeton Review and we have created a set of free SAT math resources, sponsored by Princeton Review. See this collection of SAT resources by clicking on this link to the Princeton Review resources.
If you would like to partner with Media4Math, please reach out to us at admin@media4math.com.