
These are the resources that support this NYS Standard.
NY-AII-S.IC.2: Determine if a value for a sample proportion or sample mean is likely to occur based on a given simulation.
There are 75 resources.| Title | Description | Thumbnail Image | Curriculum Topics |
|---|---|---|---|
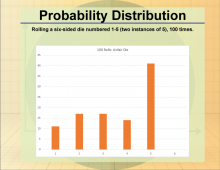
Math Clip Art--Statistics and Probability--Probability Distribution--2 |
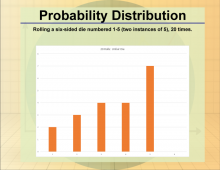
Math Clip Art--Statistics and Probability--Probability Distribution--2
This is part of a collection of math clip art images that show different statistical graphs and concepts, along with some probability concepts. |
|
Probability |
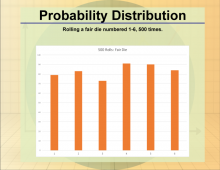
Math Clip Art--Statistics and Probability--Probability Distribution--3 |
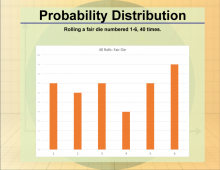
Math Clip Art--Statistics and Probability--Probability Distribution--3
This is part of a collection of math clip art images that show different statistical graphs and concepts, along with some probability concepts. |
|
Probability |
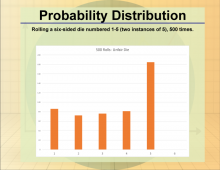
Math Clip Art--Statistics and Probability--Probability Distribution--4 |
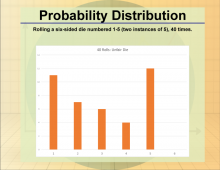
Math Clip Art--Statistics and Probability--Probability Distribution--4
This is part of a collection of math clip art images that show different statistical graphs and concepts, along with some probability concepts. |
|
Probability |
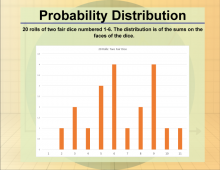
Math Clip Art--Statistics and Probability--Probability Distribution--5 |
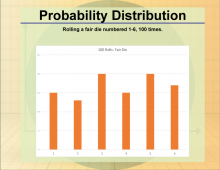
Math Clip Art--Statistics and Probability--Probability Distribution--5
This is part of a collection of math clip art images that show different statistical graphs and concepts, along with some probability concepts. |
|
Probability |
Math Clip Art--Statistics and Probability--Probability Distribution--6 |
Math Clip Art--Statistics and Probability--Probability Distribution--6
This is part of a collection of math clip art images that show different statistical graphs and concepts, along with some probability concepts. |
|
Probability |
Math Clip Art--Statistics and Probability--Probability Distribution--7 |
Math Clip Art--Statistics and Probability--Probability Distribution--7
This is part of a collection of math clip art images that show different statistical graphs and concepts, along with some probability concepts. |
|
Probability |
Math Clip Art--Statistics and Probability--Probability Distribution--8 |
Math Clip Art--Statistics and Probability--Probability Distribution--8
This is part of a collection of math clip art images that show different statistical graphs and concepts, along with some probability concepts. |
|
Probability |
Math Clip Art--Statistics and Probability--Probability Distribution--9 |
Math Clip Art--Statistics and Probability--Probability Distribution--9
This is part of a collection of math clip art images that show different statistical graphs and concepts, along with some probability concepts. |
|
Probability |
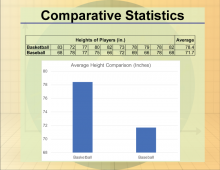
Math Clip Art--Statistics--Comparative Statistic--02 |
Math Clip Art--Statistics--Comparative Statistic--02
This is part of a collection of math clip art images that show different statistical graphs and concepts, along with some probability concepts. |
|
Data Analysis |
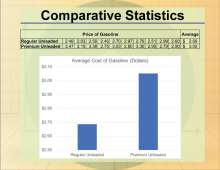
Math Clip Art--Statistics--Comparative Statistics--01 |
Math Clip Art--Statistics--Comparative Statistics--01
This is part of a collection of math clip art images that show different statistical graphs and concepts, along with some probability concepts. |
|
Data Analysis |
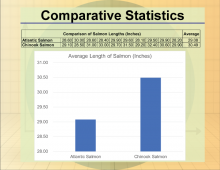
Math Clip Art--Statistics--Comparative Statistics--03 |
Math Clip Art--Statistics--Comparative Statistics--03
This is part of a collection of math clip art images that show different statistical graphs and concepts, along with some probability concepts. |
|
Data Analysis |
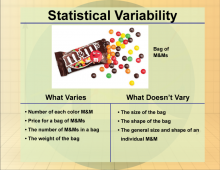
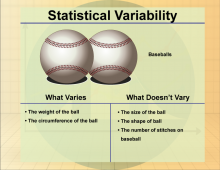
Math Clip Art--Statistics--Statistical Variability--01 |
Math Clip Art--Statistics--Statistical Variability--01
This is part of a collection of math clip art images that show different statistical graphs and concepts, along with some probability concepts. |
|
Data Gathering |
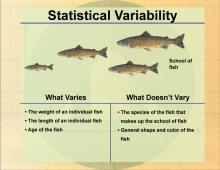
Math Clip Art--Statistics--Statistical Variability--02 |
Math Clip Art--Statistics--Statistical Variability--02
This is part of a collection of math clip art images that show different statistical graphs and concepts, along with some probability concepts. |
|
Data Gathering |
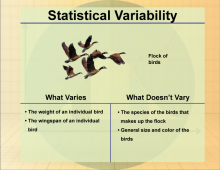
Math Clip Art--Statistics--Statistical Variability--03 |
Math Clip Art--Statistics--Statistical Variability--03
This is part of a collection of math clip art images that show different statistical graphs and concepts, along with some probability concepts. |
|
Data Gathering |
Math Clip Art--Statistics--Statistical Variability--04 |
Math Clip Art--Statistics--Statistical Variability--04
This is part of a collection of math clip art images that show different statistical graphs and concepts, along with some probability concepts. |
|
Data Gathering |
Math in the News: Issue 105--Movie Statistics: 2014 |
Math in the News: Issue 105--Movie Statistics: 2014
January 2015. In this issue of Math in the News we review box office statistics for the previous year. |
|
Data Analysis |
Math in the News: Issue 106--A Box Office Monster! |
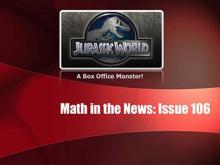
Math in the News: Issue 106--A Box Office Monster!
July 2015. In this issue of Math in the News we analyze the amazing box office success of the recently released Jurassic World. This provides an excellent application of data analysis and linear equations. |
|
Applications of Linear Functions, Standard Form and Data Analysis |
Math in the News: Issue 108--Star Wars |
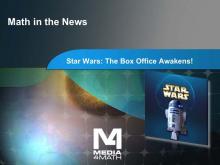
Math in the News: Issue 108--Star Wars: The Box Office Awakens!
January 2016. In this issue of Math in the News we explore the dramatic box office returns of Star Wars: The Force Awakens. It provides an excellent opportunity to apply concepts of linear systems. |
|
Applications of Linear Systems and Data Analysis |
Math in the News: Issue 119--Who Will Win the World Cup? |
Math in the News: Issue 119 | Who Will Win the World Cup?
December 2022. In this issue of Math in the News we look at a probability model for predicting the winner of the World Cup. |

|
Probability |
Math in the News: Issue 50--March Madness Made Rational |
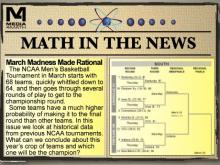
Math in the News: Issue 50--March Madness Made Rational
March 2012. In this issue we look at March Madness mathematically. |
|
Data Analysis |
Math in the News: Issue 72--Box Office Flop! |
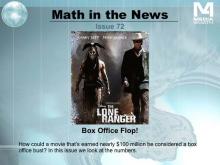
Math in the News: Issue 72--Box Office Flop!
August 2013. In this issue we analyze why the movie the Lone Ranger is considered a box office flop, even though it has earned nearly $100 million. We analyze box office data. |
|
Applications of Exponential and Logarithmic Functions, Data Analysis and Sequences |
Math in the News: Issue 93--Saving for College |
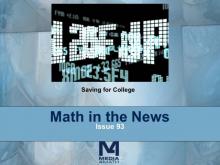
Math in the News: Issue 93--Saving for College
February 2014. In this issue of Math in the News we look at the investment strategy known as Dollar Cost Averaging. We explore several simulated scenarios and look at the pros and cons of this strategy. |
|
Data Analysis |
Math Simulation: Probability: Rolling One Die |
Math Simulation: Probability: Rolling One Die
Use this Math Simulation to have students conduct probability experiments. In this Simulation one die is rolled. The Simulation tracks the following data: Total Number of Rolls, Number of occurrences of 1, 2, 3, 4, 5, and 6. |
|
Probability |
Math Simulation: Probability: Rolling One Number Cube |
Math Simulation: Probability: Rolling One Number Cube
Use this Math Simulation to have students conduct probability experiments. In this Simulation one number cube is rolled. The Simulation tracks the following data: Total Number of Rolls, Number of occurrences of 1, 2, 3, 4, 5, and 6. |
|
Probability |
Math Simulation: Probability: Rolling Two Dice |
Math Simulation: Probability: Rolling Two Dice
Use this Math Simulation to have students conduct probability experiments. In this Simulation two dice are rolled. The Simulation tracks the following data: Total Number of Rolls, Number of occurrences of 2, 3, 4, 5, 6, 7, 8, 9, 10, 11, and 12. |
|
Probability |
Join the hundreds of thousands of math educators who have used Media4Math resources in their classroom to engage their students. Our new integrated Library/Classroom product has everything you need!
About Media4Math
Our Mission
Media4Math's mission is to educate 21st-century students in real-world applications of math with digital technology. We bring math to life in your classroom with a rich blend of resources to inspire your students to learn. Our philosophy is that the procedural side of math is a prerequisite to using it, but we also find that real-world math applications can provide motivation and even inspiration for math students. Math is its own language and it has important stories to tell. While many of our resources are for procedural skills, there are many resources that are real-world applications of math. Some of these resources rely on partnerships with other educational publishers.
About Media4Math Library
Media4Math Library contains over 15,000 high-quality resources designed for classroom or home use. This includes instructional, remediation, and assessment resources. You'll find truly innovative resources that bring math to life. Resources in Media4Math Library include:
- Videos
- Math Clip Art
- Math Examples
- Quizzes
- Tutorials
- PowerPoint and Google Slide presentations
- GoogleEarth Voyager Stories
- Algebra Applications
- Geometry Explorations
- Quizlet Flash Cards
- Desmos Resources
- Texas Instrument Resources
- Games and Simulations
About Media4Math Classroom
Media4Math Classroom provides ready-to-use interactive math lessons that teach, assess, and provide real-world applications of topics in Pre-Algebra, Algebra, and Geometry. Assign these modules to your students and capture assessment scores in an easy-to-use Dashboard. This is a growing library of instructional modules. Topics include:
- Arithmetic
- Pre-Algebra
- Algebra
- Geometry
- SAT Math Prep
Media4Math Classroom modules provide real world applications of math that will motivate your students. Here are some examples:
- Construction Site Math. Apply ratios and proportions to mixtures of cement and concrete. This module includes video resources and your students will get a real-world application of ratios and proportions.
- Counting Bison. Apply place value concepts to the real-world application of the bison population. Because the bison population has gone through dramatic changes in population, this become an opportunity to use and apply place value.
- Wildlife Refuge. This study of area and perimeter centers on the mustang population in the Nevada area. Students explore the relationship between area and perimeter of rectangular shapes in the context of designing a wildlife refuge.
The Media4Math Bundle
A subscription to the Media4Math bundle gives teachers access to all the resources listed above. Specifically:
- Access to all the Media4Math Library resources and tools.
- Access to all the Media4Math Classroom instructional modules.
To learn more about our subscription packages, contact us at admin@media4math.com.
Partnering with Media4Math
Media4Math prides itself on its strategic partnerships with other educational organizations. Our partnerships include the following partners:
-
Google Earth. Media4Math has partnered with GoogleEarth to create a comprehensive library of GoogleEarth Voyager Stories. These map-based explorations of geometry, geography, and culture will literally bring the math to life. See our collection of Voyager Stories by clicking on this link to the Google Earth resources.
-
Texas Instruments. TI is the leading provider of graphing calculators used in the classroom. Media4Math has partnered with TI to create a library of digital resources to support the use of these graphing calculators. These resources include videos, presentations, and related tutorials. See our collection of TI resources by clicking on this link to the TI resources.
-
Desmos. This free online resource that includes a graphing calculator and geometry tools. Media4Math has created an extensive library of resources that support the use of these Desmos resources. See our collection of Desmos resources by clicking on this link to the Desmos resources.
- Quizlet. We have partnered with the leading provider of interactive Flash Cards and is used by millions of teachers and students around the world. Media4Math has developed an extensive library of Quizlet resources. See our collection of Quizlet resources by clicking on this link to the Quizlet resources.
Link to the Media4Math Study Sets on Quizlet and search for "Media4Math."
- The Princeton Review. The Princeton Review is the leading provider of SAT prep and other test preparation courses and tutorials. Media4Math is an affiliate of Princeton Review and we have created a set of free SAT math resources, sponsored by Princeton Review. See this collection of SAT resources by clicking on this link to the Princeton Review resources.
If you would like to partner with Media4Math, please reach out to us at admin@media4math.com.