These are the resources that support this Common Core Standard.
CCSS.MATH.CONTENT.HSS.ID.A.2 -
Displaying 1 - 50 of 263 resources:
| Thumbnail Image | Title | Description | Curriculum Nodes |
|---|---|---|---|
|
Math Clip Art Collection: Statistics |
This collection aggregates all the math clip art around the topic of Statistics. There are a total of 55 images. | Data Analysis, Probability, Data Gathering and Counting |
|
Math Definitions Collection: Charts and Graphs |
This collection aggregates all the definition image cards around the topic of Charts and Graphs. There are a total of 16 terms. | Data Analysis |
|
Math Definitions Collection: Statistics and Probability |
This collection aggregates all the definition image cards around the topic of Statistics and Probability terms and vocabulary. There are a total of 34 terms. | Data Analysis, Probability and Data Gathering |
|
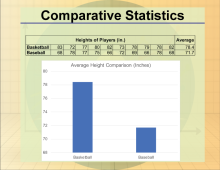
Math Examples Collection: Charts, Graphs, and Plots |
This collection aggregates all the math examples around the topic of Charts, Graphs, and Plots. There are a total of 38 Math Examples. This collection of resources is made up of downloadable PNG images that you can easily incorporate into your lesson plans. | Slope-Intercept Form, Data Analysis, Point-Slope Form and Subtraction Facts to 100 |

|
Math Examples Collection: Data Plots |
This collection aggregates all the math examples around the topic of Data Plots. There are a total of 4 Math Examples. | Data Analysis |
|
Math Examples Collection: The Mean |
This collection aggregates all the math examples around the topic of the Mean. There are a total of 42 Math Examples. | Data Analysis |
|
Math Examples Collection: The Median |
This collection aggregates all the math examples around the topic of the Median. There are a total of 40 Math Examples. | Data Analysis |
|
Math Examples Collection: The Mode |
This collection aggregates all the math examples around the topic of the Mode. There are a total of 78 Math Examples. | Data Analysis |

|
Math in the News Collection: Applications of Data Analysis |
This is a collection of Math in the News stories that focus on the topic of Data Analysis. | Data Analysis, Data Gathering, Probability, Percents and Ratios and Rates |
|
Math in the News Collection: Applications of Ratios |
This is a collection of Math in the News stories that focus on the topic of Ratios, Proportions, and Percents. | Applications of Ratios, Proportions, and Percents and Proportions |
|
Math Video Collection: Texas Instruments Tutorial Videos |
This collection aggregates all the math videos and resources in this series: Texas Instruments Tutorial Videos. There are a total of 266 resources. | Rational Expressions, Sequences, Series, Polynomial Functions and Equations, Graphs of Quadratic Functions, Quadratic Equations and Functions, Solving Systems of Equations, Trig Expressions and Identities, Probability, Geometric Constructions with Triangles, Composite Functions, Geometric Constructions with Angles and Planes, Distance Formula, Data Analysis, Slope, Special Functions, Trigonometric Functions, Graphs of Exponential and Logarithmic Functions, Radical Functions and Equations, Rational Functions and Equations, Slope-Intercept Form, Coordinate Systems, Graphs of Linear Functions, Inequalities, Matrix Operations and Midpoint Formula |

|
Math Video Collection: Video Tutorials Series: Measures of Central Tendency |
This collection aggregates all the math videos and resources in this series: Video Tutorials Series: Measures of Central Tendency. There are a total of 24 resources. | Data Analysis and Data Gathering |
|
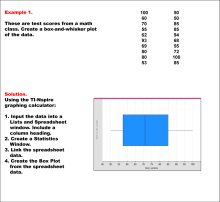
Closed Captioned Video: Box-and-Whisker Plot |
Closed Captioned Video: Box-and-Whisker Plot
In this TI Nspire tutorial the Spreadsheet and Statistics windows are used to create a box-and-whisker plot. |
Data Analysis |
|
Closed Captioned Video: Creating a Histogram |
Closed Captioned Video: Creating a Histogram
In this TI Nspire tutorial, the Spreadsheet and Statistics windows are used to create a histogram. This video supports the TI-Nspire Clickpad and Touchpad. |
Data Analysis |

|
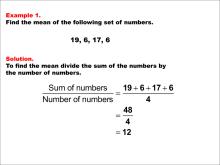
Closed Captioned Video: Measures of Central Tendency: Finding the Mean of a Data Set I |
Closed Captioned Video: Measures of Central Tendency: Finding the Mean of a Data Set I
In this video tutorial students learn how to calculate the mean when all of the data items are positive numbers. |
Data Analysis and Data Gathering |
|
Closed Captioned Video: Measures of Central Tendency: Finding the Mean of a Data Set II |
Closed Captioned Video: Measures of Central Tendency: Finding the Mean of a Data Set II
In this video tutorial students learn how to calculate the mean when some of the data items are negative numbers. |
Data Analysis and Data Gathering |

|
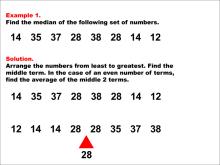
Closed Captioned Video: Measures of Central Tendency: Finding the Median of a Data Set |
Closed Captioned Video: Measures of Central Tendency: Finding the Median of a Data Set
In this video tutorial students learn how to find the median of a data set. |
Data Analysis and Data Gathering |

|
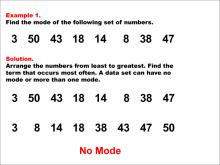
Closed Captioned Video: Measures of Central Tendency: Finding the Mode of a Data Set |
Closed Captioned Video: Measures of Central Tendency: Finding the Mode of a Data Set
In this video tutorial students learn how to calculate the mode of a data set, as well as how the mode differs from the mea |
Data Analysis and Data Gathering |

|
Closed Captioned Video: Measures of Central Tendency: Mean of a Probability Distribution |
Closed Captioned Video: Measures of Central Tendency: Mean of a Probability Distribution
In this video tutorial students learn about the mean of a probability distribution. |
Data Analysis and Data Gathering |
|
Closed Captioned Video: Measures of Central Tendency: Sample Mean |
Closed Captioned Video: Measures of Central Tendency: Sample Mean
In this video tutorial students learn about sample mean from a random sampling of data. |
Data Analysis and Data Gathering |
|
Closed Captioned Video: Measures of Central Tendency: The Mean and Normally Distributed Data |
Closed Captioned Video: Measures of Central Tendency: The Mean and Normally Distributed Data
In this video tutorial students learn about normally distributed data and how to identify the population mean from |
Data Analysis and Data Gathering |

|
Closed Captioned Video: Measures of Central Tendency: Weighted Mean |
Closed Captioned Video: Measures of Central Tendency: Weighted Mean
In this video tutorial students extend their understanding of mean by looking at examples of weighted means (sometimes referred to as weight |
Data Analysis and Data Gathering |
|
Closed Captioned Video: Probability Simulation 1 |
Closed Captioned Video: Probability Simulation 1
In this TI Nspire tutorialthe Spreadsheet and Statistics windows are used to create a probability simulation of tossing two dice. |
Probability |
|
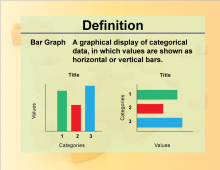
Definition--Charts and Graphs--Bar Graph |
Definition--Charts and Graphs--Bar Graph
This is a collection of definitions related to the concept of charts, graphs, and data displays. |
Data Analysis |
|
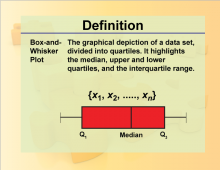
Definition--Charts and Graphs--Box-and-Whisker Plot |
Definition--Charts and Graphs--Box-and-Whisker Plot
This is a collection of definitions related to the concept of charts, graphs, and data displays. |
Data Analysis |
|
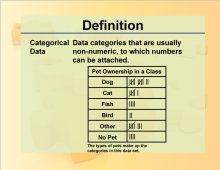
Definition--Charts and Graphs--Categorical Data |
Definition--Charts and Graphs--Categorical Data
This is a collection of definitions related to the concept of charts, graphs, and data displays. |
Data Analysis |
|
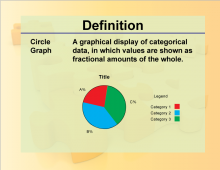
Definition--Charts and Graphs--Circle Graph |
Definition--Charts and Graphs--Circle Graph
This is a collection of definitions related to the concept of charts, graphs, and data displays. |
Data Analysis |
|
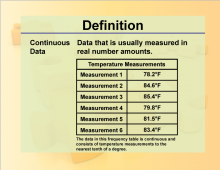
Definition--Charts and Graphs--Continuous Data |
Definition--Charts and Graphs--Continuous Data
This is a collection of definitions related to the concept of charts, graphs, and data displays. |
Data Analysis |
|
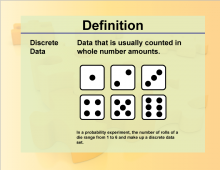
Definition--Charts and Graphs--Discrete Data |
Definition--Charts and Graphs--Discrete Data
This is a collection of definitions related to the concept of charts, graphs, and data displays. |
Data Analysis |
|
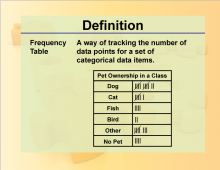
Definition--Charts and Graphs--Frequency Table |
Definition--Charts and Graphs--Frequency Table
This is a collection of definitions related to the concept of charts, graphs, and data displays. |
Data Analysis |
|
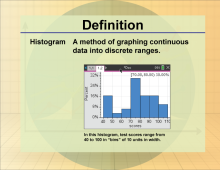
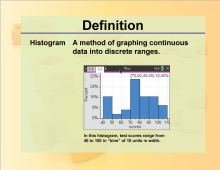
Definition--Charts and Graphs--Histogram |
Definition--Charts and Graphs--Histogram
This is a collection of definitions related to the concept of charts, graphs, and data displays. |
Data Analysis |
|
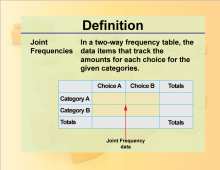
Definition--Charts and Graphs--Joint Frequencies |
Definition--Charts and Graphs--Joint Frequencies
This is a collection of definitions related to the concept of charts, graphs, and data displays. |
Data Analysis |
|
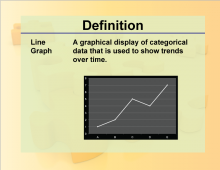
Definition--Charts and Graphs--Line Graph |
Definition--Charts and Graphs--Line Graph
This is a collection of definitions related to the concept of charts, graphs, and data displays. |
Data Analysis |
|
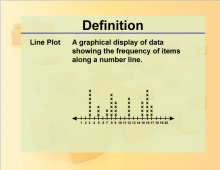
Definition--Charts and Graphs--Line Plot |
Definition--Charts and Graphs--Line Plot
This is a collection of definitions related to the concept of charts, graphs, and data displays. |
Data Analysis |
|
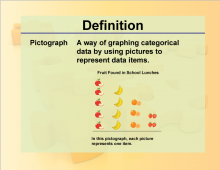
Definition--Charts and Graphs--Pictograph |
Definition--Charts and Graphs--Pictograph
This is a collection of definitions related to the concept of charts, graphs, and data displays. |
Data Analysis |
|
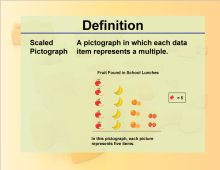
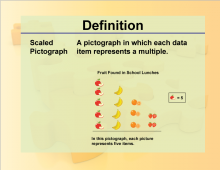
Definition--Charts and Graphs--Scaled Pictograph |
Definition--Charts and Graphs--Scaled Pictograph
This is a collection of definitions related to the concept of charts, graphs, and data displays. |
Data Analysis |
|
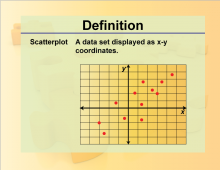
Definition--Charts and Graphs--Scatterplot |
Definition--Charts and Graphs--Scatterplot
This is a collection of definitions related to the concept of charts, graphs, and data displays. |
Data Analysis |
|
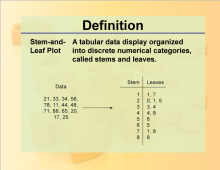
Definition--Charts and Graphs--Stem-and-Leaf Plot |
Definition--Charts and Graphs--Stem-and-Leaf Plot
This is a collection of definitions related to the concept of charts, graphs, and data displays. |
Data Analysis |
|
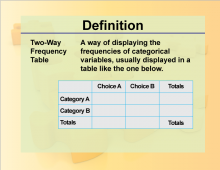
Definition--Charts and Graphs--Two-Way Frequency Table |
Definition--Charts and Graphs--Two-Way Frequency Table
This is a collection of definitions related to the concept of charts, graphs, and data displays. |
Data Analysis |
|
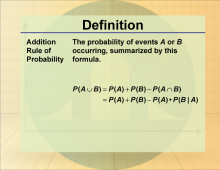
Definition--Statistics and Probability Concepts--Addition Rule of Probability |
Addition Rule of Probability | Data Analysis |
|
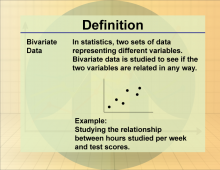
Definition--Statistics and Probability Concepts--Bivariate Data |
Bivariate Data | Data Analysis |
|
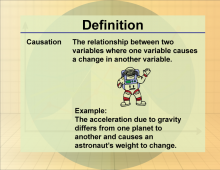
Definition--Statistics and Probability Concepts--Causation |
Causation | Data Analysis |
|
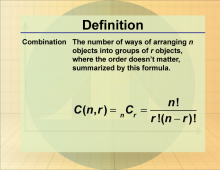
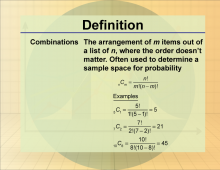
Definition--Statistics and Probability Concepts--Combination 1 |
Combination 1 | Data Analysis |
|
Definition--Statistics and Probability Concepts--Combination 2 |
Combination 2 | Probability |
|
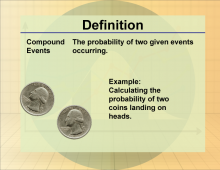
Definition--Statistics and Probability Concepts--Compound Events |
Compound Events | Probability |
|
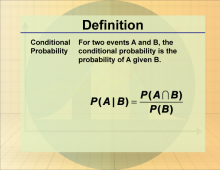
Definition--Statistics and Probability Concepts--Conditional Probability |
Conditional Probability | Data Analysis |
|
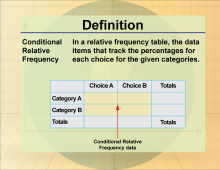
Definition--Statistics and Probability Concepts--Conditional Relative Frequency |
Conditional Relative Frequency | Data Analysis |
|
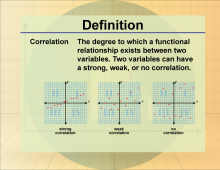
Definition--Statistics and Probability Concepts--Correlation 1 |
Correlation 1 | Data Analysis |
|
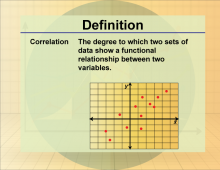
Definition--Statistics and Probability Concepts--Correlation 2 |
Correlation 2 | Data Analysis |
|
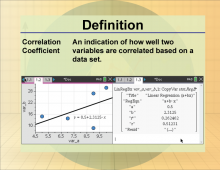
Definition--Statistics and Probability Concepts--Correlation Coefficient |
Correlation Coefficient | Data Analysis |