These are the resources that support this Florida Standard.
MA.4.DP.1.1 - Collect and represent numerical data, including fractional values, using tables, stem-and-leaf plots or line plots.
Displaying 1 - 21 of 21 resources:
| Thumbnail Image | Title | Description | Curriculum Nodes |
|---|---|---|---|
|
Math Definitions Collection: Charts and Graphs |
This collection aggregates all the definition image cards around the topic of Charts and Graphs. There are a total of 16 terms. | Data Analysis |
|
Math Definitions Collection: Statistics and Probability |
This collection aggregates all the definition image cards around the topic of Statistics and Probability terms and vocabulary. There are a total of 34 terms. | Data Analysis, Probability and Data Gathering |
|
Math Examples Collection: Charts, Graphs, and Plots |
This collection aggregates all the math examples around the topic of Charts, Graphs, and Plots. There are a total of 38 Math Examples. This collection of resources is made up of downloadable PNG images that you can easily incorporate into your lesson plans. | Slope-Intercept Form, Data Analysis, Point-Slope Form and Subtraction Facts to 100 |

|
Math Examples Collection: Data Plots |
This collection aggregates all the math examples around the topic of Data Plots. There are a total of 4 Math Examples. | Data Analysis |
|
Math Examples Collection: Graphs From Categorical Data |
This collection aggregates all the math examples around the topic of Graphs of Categorical Data. There are a total of 6 Math Examples. | Data Analysis |
|
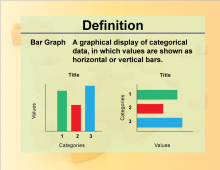
Definition--Charts and Graphs--Bar Graph |
Definition--Charts and Graphs--Bar Graph
This is a collection of definitions related to the concept of charts, graphs, and data displays. |
Data Analysis |
|
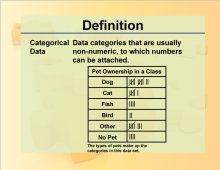
Definition--Charts and Graphs--Categorical Data |
Definition--Charts and Graphs--Categorical Data
This is a collection of definitions related to the concept of charts, graphs, and data displays. |
Data Analysis |
|
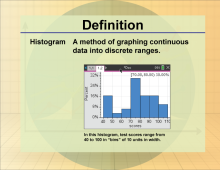
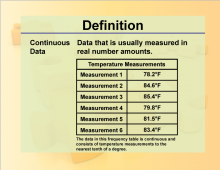
Definition--Charts and Graphs--Continuous Data |
Definition--Charts and Graphs--Continuous Data
This is a collection of definitions related to the concept of charts, graphs, and data displays. |
Data Analysis |
|
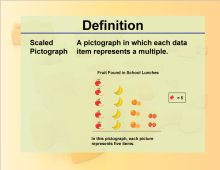
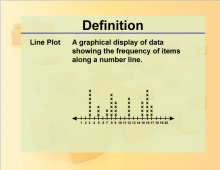
Definition--Charts and Graphs--Line Plot |
Definition--Charts and Graphs--Line Plot
This is a collection of definitions related to the concept of charts, graphs, and data displays. |
Data Analysis |
|
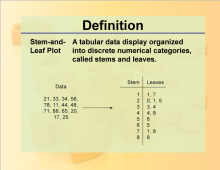
Definition--Charts and Graphs--Stem-and-Leaf Plot |
Definition--Charts and Graphs--Stem-and-Leaf Plot
This is a collection of definitions related to the concept of charts, graphs, and data displays. |
Data Analysis |
|
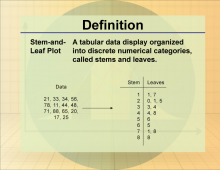
Definition--Statistics and Probability Concepts--Stem-and-Leaf Plot |
Definition--Statistics and Probability Concepts--Stem-and-Leaf Plot
This is part of a collection of definitions on the topic of probability and statistics. Each definition includes an example of the term. |
Data Analysis |
|
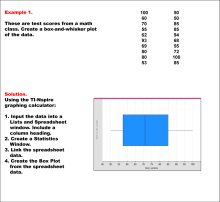
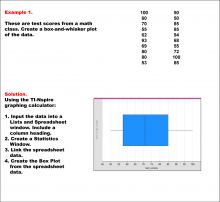
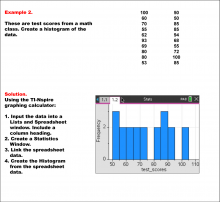
Math Example--Charts, Graphs, and Plots--Data Plot--Example 1 |
Math Example--Charts, Graphs, and Plots-- Data Plot--Example 1
In this set of math examples, analyze the behavior of different scatterplots. This includes linear and quadratic models. |
Data Analysis |
|
Math Example--Charts, Graphs, and Plots--Data Plot--Example 2 |
Math Example--Charts, Graphs, and Plots-- Data Plot--Example 2
In this set of math examples, analyze the behavior of different scatterplots. This includes linear and quadratic models. |
Data Analysis |
|
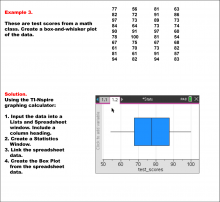
Math Example--Charts, Graphs, and Plots--Data Plot--Example 3 |
Math Example--Charts, Graphs, and Plots-- Data Plot--Example 3
In this set of math examples, analyze the behavior of different scatterplots. This includes linear and quadratic models. |
Data Analysis |
|
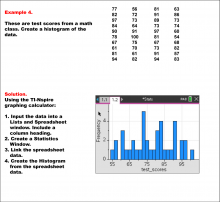
Math Example--Charts, Graphs, and Plots--Data Plot--Example 4 |
Math Example--Charts, Graphs, and Plots-- Data Plot--Example 4
In this set of math examples, analyze the behavior of different scatterplots. This includes linear and quadratic models. |
Data Analysis |

|
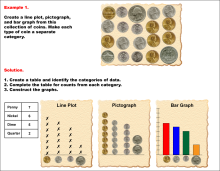
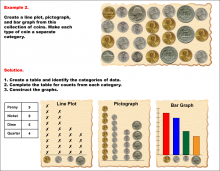
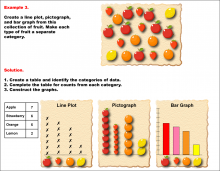
Math Example--Charts, Graphs, and Plots--Graphs of Categorical Data--Example 1 |
Math Example--Charts, Graphs, and Plots-- Graphs of Categorical Data--Example 1
In this set of math examples, analyze the behavior of different scatterplots. This includes linear and quadratic models. |
Data Analysis |
|
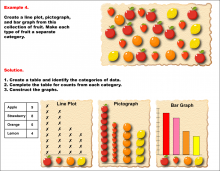
Math Example--Charts, Graphs, and Plots--Graphs of Categorical Data--Example 2 |
Math Example--Charts, Graphs, and Plots-- Graphs of Categorical Data--Example 2
In this set of math examples, analyze the behavior of different scatterplots. This includes linear and quadratic models. |
Data Analysis |
|
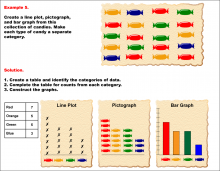
Math Example--Charts, Graphs, and Plots--Graphs of Categorical Data--Example 3 |
Math Example--Charts, Graphs, and Plots-- Graphs of Categorical Data--Example 3
In this set of math examples, analyze the behavior of different scatterplots. This includes linear and quadratic models. |
Data Analysis |
|
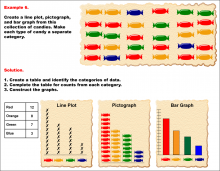
Math Example--Charts, Graphs, and Plots--Graphs of Categorical Data--Example 4 |
Math Example--Charts, Graphs, and Plots-- Graphs of Categorical Data--Example 4
In this set of math examples, analyze the behavior of different scatterplots. This includes linear and quadratic models. |
Data Analysis |
|
Math Example--Charts, Graphs, and Plots--Graphs of Categorical Data--Example 5 |
Math Example--Charts, Graphs, and Plots-- Graphs of Categorical Data--Example 5
In this set of math examples, analyze the behavior of different scatterplots. This includes linear and quadratic models. |
Data Analysis |
|
Math Example--Charts, Graphs, and Plots--Graphs of Categorical Data--Example 6 |
Math Example--Charts, Graphs, and Plots-- Graphs of Categorical Data--Example 6
In this set of math examples, analyze the behavior of different scatterplots. This includes linear and quadratic models. |
Data Analysis |