Display Title
Definition--Statistics and Probability Concepts--Stem-and-Leaf Plot
Display Title
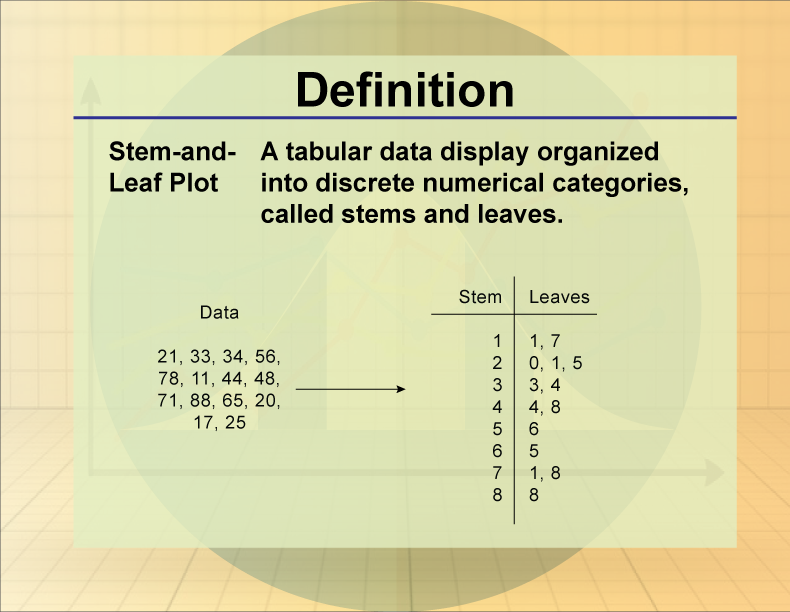
Stem-and-Leaf Plot

Topic
Statistics and Probability
Definition
A stem-and-leaf plot is a graphical representation that organizes data points based on their place value.
Description
Stem-and-leaf plots are useful for displaying the distribution of a dataset in a concise format, preserving the original data while showing its shape. They are particularly helpful in exploratory data analysis to identify patterns and outliers.
In educational settings, stem-and-leaf plots are used to teach students about data organization and visualization. Understanding this concept helps students develop skills in data interpretation and enhances their ability to summarize data effectively.
For a complete collection of terms related to Probability and Statistics click on this link: Probability and Statistics Collection.
| Common Core Standards | CCSS.MATH.CONTENT.6.SP.B.4, CCSS.MATH.CONTENT.6.SP.A.2, CCSS.MATH.CONTENT.HSS.ID.A.1, CCSS.MATH.CONTENT.HSS.ID.A.2, CCSS.MATH.CONTENT.HSS.ID.A.3, CCSS.MATH.CONTENT.HSS.ID.A.4 |
|---|---|
| Grade Range | 6 - 12 |
| Curriculum Nodes |
Algebra • Probability and Data Analysis • Data Analysis |
| Copyright Year | 2013 |
| Keywords | stem-and-leaf plot, stem and leaf plot, data analysis, definitions, glossary term |