These are the resources that support this Florida Standard.
MA.912.DP.3.4 - Given a relative frequency table, construct and interpret a segmented bar graph.
Displaying 51 - 89 of 89 resources:
| Thumbnail Image | Title | Description | Curriculum Nodes |
|---|---|---|---|
|
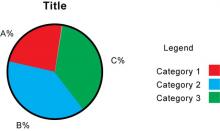
Math Clip Art--Statistics and Probability--Circle Graph |
Math Clip Art--Statistics and Probability--Circle Graph
This is part of a collection of math clip art images that show different statistical graphs and concepts, along with some probability concepts. |
Data Analysis |
|
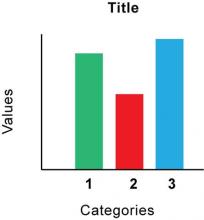
Math Clip Art--Statistics--Bar Graph |
Math Clip Art--Statistics--Bar Graph
This is part of a collection of math clip art images that show different statistical graphs and concepts, along with some probability concepts. |
Data Analysis |
|
|
Math Clip Art--Statistics--Bar Graph |
Math Clip Art--Statistics--Bar Graph
This is part of a collection of math clip art images that show different statistical graphs and concepts, along with some probability concepts. |
Data Analysis |
|
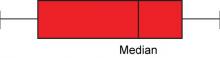
Math Clip Art--Statistics--Box and Whisker Plot |
Math Clip Art--Statistics--Box and Whisker Plot
This is part of a collection of math clip art images that show different statistical graphs and concepts, along with some probability concepts. |
Data Analysis |
|
|
Math Clip Art--Statistics--Box and Whisker Plot |
Math Clip Art--Statistics--Box and Whisker Plot
This is part of a collection of math clip art images that show different statistical graphs and concepts, along with some probability concepts. |
Data Analysis |
|
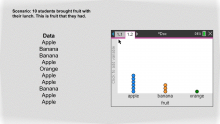
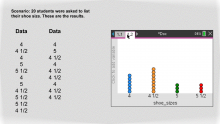
Math Clip Art--Statistics--Line Plots with Data--01 |
Math Clip Art--Statistics--Line Plots with Data--01
This is part of a collection of math clip art images that show different statistical graphs and concepts, along with some probability concepts. |
Data Analysis |
|
|
Math Clip Art--Statistics--Line Plots with Data--01 |
Math Clip Art--Statistics--Line Plots with Data--01
This is part of a collection of math clip art images that show different statistical graphs and concepts, along with some probability concepts. |
Data Analysis |
|
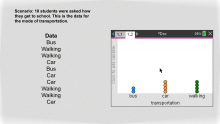
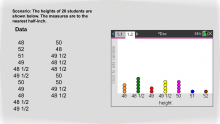
Math Clip Art--Statistics--Line Plots with Data--02 |
Math Clip Art--Statistics--Line Plots with Data--02
This is part of a collection of math clip art images that show different statistical graphs and concepts, along with some probability concepts. |
Data Analysis |
|
|
Math Clip Art--Statistics--Line Plots with Data--02 |
Math Clip Art--Statistics--Line Plots with Data--02
This is part of a collection of math clip art images that show different statistical graphs and concepts, along with some probability concepts. |
Data Analysis |
|
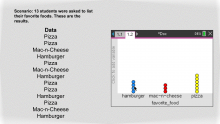
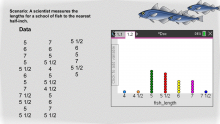
Math Clip Art--Statistics--Line Plots with Data--03 |
Math Clip Art--Statistics--Line Plots with Data--03
This is part of a collection of math clip art images that show different statistical graphs and concepts, along with some probability concepts. |
Data Analysis |
|
|
Math Clip Art--Statistics--Line Plots with Data--03 |
Math Clip Art--Statistics--Line Plots with Data--03
This is part of a collection of math clip art images that show different statistical graphs and concepts, along with some probability concepts. |
Data Analysis |
|
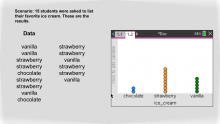
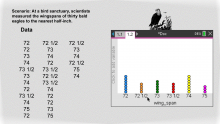
Math Clip Art--Statistics--Line Plots with Data--04 |
Math Clip Art--Statistics--Line Plots with Data--04
This is part of a collection of math clip art images that show different statistical graphs and concepts, along with some probability concepts. |
Data Analysis |
|
|
Math Clip Art--Statistics--Line Plots with Data--04 |
Math Clip Art--Statistics--Line Plots with Data--04
This is part of a collection of math clip art images that show different statistical graphs and concepts, along with some probability concepts. |
Data Analysis |
|
Math Clip Art--Statistics--Line Plots with Data--05 |
Math Clip Art--Statistics--Line Plots with Data--05
This is part of a collection of math clip art images that show different statistical graphs and concepts, along with some probability concepts. |
Data Analysis |
|
|
Math Clip Art--Statistics--Line Plots with Data--05 |
Math Clip Art--Statistics--Line Plots with Data--05
This is part of a collection of math clip art images that show different statistical graphs and concepts, along with some probability concepts. |
Data Analysis |
|
Math Clip Art--Statistics--Line Plots with Data--06 |
Math Clip Art--Statistics--Line Plots with Data--06
This is part of a collection of math clip art images that show different statistical graphs and concepts, along with some probability concepts. |
Data Analysis |
|
|
Math Clip Art--Statistics--Line Plots with Data--06 |
Math Clip Art--Statistics--Line Plots with Data--06
This is part of a collection of math clip art images that show different statistical graphs and concepts, along with some probability concepts. |
Data Analysis |
|
Math Clip Art--Statistics--Line Plots with Data--07 |
Math Clip Art--Statistics--Line Plots with Data--07
This is part of a collection of math clip art images that show different statistical graphs and concepts, along with some probability concepts. |
Data Analysis |
|
|
Math Clip Art--Statistics--Line Plots with Data--07 |
Math Clip Art--Statistics--Line Plots with Data--07
This is part of a collection of math clip art images that show different statistical graphs and concepts, along with some probability concepts. |
Data Analysis |
|
Math Clip Art--Statistics--Line Plots with Data--08 |
Math Clip Art--Statistics--Line Plots with Data--08
This is part of a collection of math clip art images that show different statistical graphs and concepts, along with some probability concepts. |
Data Analysis |
|
|
Math Clip Art--Statistics--Line Plots with Data--08 |
Math Clip Art--Statistics--Line Plots with Data--08
This is part of a collection of math clip art images that show different statistical graphs and concepts, along with some probability concepts. |
Data Analysis |
|
Math Clip Art--Statistics--Line Plots with Data--09 |
Math Clip Art--Statistics--Line Plots with Data--09
This is part of a collection of math clip art images that show different statistical graphs and concepts, along with some probability concepts. |
Data Analysis |
|
|
Math Clip Art--Statistics--Line Plots with Data--09 |
Math Clip Art--Statistics--Line Plots with Data--09
This is part of a collection of math clip art images that show different statistical graphs and concepts, along with some probability concepts. |
Data Analysis |
|
Math Clip Art--Statistics--Line Plots with Data--10 |
Math Clip Art--Statistics--Line Plots with Data--10
This is part of a collection of math clip art images that show different statistical graphs and concepts, along with some probability concepts. |
Data Analysis |
|
|
Math Clip Art--Statistics--Line Plots with Data--10 |
Math Clip Art--Statistics--Line Plots with Data--10
This is part of a collection of math clip art images that show different statistical graphs and concepts, along with some probability concepts. |
Data Analysis |

|
Video Transcript: TI-Nspire Mini-Tutorial: Creating a Histogram |
Video Transcript: TI-Nspire Mini-Tutorial: Creating a Histogram
This is the transcript for the TI-Nspire Mini-Tutorial entitled, Creating a Histogram. |
Data Analysis |
|
|
Video Transcript: TI-Nspire Mini-Tutorial: Creating a Histogram |
Video Transcript: TI-Nspire Mini-Tutorial: Creating a Histogram
This is the transcript for the TI-Nspire Mini-Tutorial entitled, Creating a Histogram. |
Data Analysis |
|
|
Video Transcript: TI-Nspire Mini-Tutorial: Creating a Random Number Table |
Video Transcript: TI-Nspire Mini-Tutorial: Creating a Random Number Table
This is the transcript for the TI-Nspire Mini-Tutorial entitled, Creating a Random Number Table. |
Probability |
|
|
Video Transcript: TI-Nspire Mini-Tutorial: Creating a Random Number Table |
Video Transcript: TI-Nspire Mini-Tutorial: Creating a Random Number Table
This is the transcript for the TI-Nspire Mini-Tutorial entitled, Creating a Random Number Table. |
Probability |
|
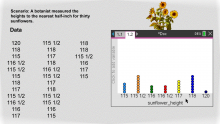
Worksheet: TI-Nspire Mini-Tutorial: Creating a Histogram |
Worksheet: TI-Nspire Mini-Tutorial: Creating a Histogram
This is part of a collection of math worksheets on the use of the TI-Nspire graphing calculator. |
Data Analysis |
|
|
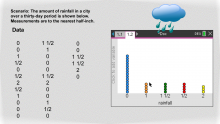
Worksheet: TI-Nspire Mini-Tutorial: Creating a Histogram |
Worksheet: TI-Nspire Mini-Tutorial: Creating a Histogram
This is part of a collection of math worksheets on the use of the TI-Nspire graphing calculator. |
Data Analysis |
|
|
Worksheet: TI-Nspire Mini-Tutorial: Creating a Random Number Table |
Worksheet: TI-Nspire Mini-Tutorial: Creating a Random Number Table
This is part of a collection of math worksheets on the use of the TI-Nspire graphing calculator. |
Probability |
|
|
Worksheet: TI-Nspire Mini-Tutorial: Creating a Random Number Table |
Worksheet: TI-Nspire Mini-Tutorial: Creating a Random Number Table
This is part of a collection of math worksheets on the use of the TI-Nspire graphing calculator. |
Probability |
|
|
Worksheet: TI-Nspire Mini-Tutorial: Graphing a Box-and-Whisker Plot |
Worksheet: TI-Nspire Mini-Tutorial: Graphing a Box-and-Whisker Plot
This is part of a collection of math worksheets on the use of the TI-Nspire graphing calculator. |
Data Analysis |
|
|
Worksheet: TI-Nspire Mini-Tutorial: Graphing a Box-and-Whisker Plot |
Worksheet: TI-Nspire Mini-Tutorial: Graphing a Box-and-Whisker Plot
This is part of a collection of math worksheets on the use of the TI-Nspire graphing calculator. |
Data Analysis |
|
|
Worksheet: TI-Nspire Mini-Tutorial: Graphing a Scatterplot Using a Graphs and Geometry Window |
Worksheet: TI-Nspire Mini-Tutorial: Graphing a Scatterplot Using a Graphs and Geometry Window
This is part of a collection of math worksheets on the use of the TI-Nspire graphing calculator. |
Data Analysis |
|
|
Worksheet: TI-Nspire Mini-Tutorial: Graphing a Scatterplot Using a Statistics Window |
Worksheet: TI-Nspire Mini-Tutorial: Graphing a Scatterplot Using a Statistics Window
This is part of a collection of math worksheets on the use of the TI-Nspire graphing calculator. |
Data Analysis |
|
|
Worksheet: TI-Nspire Mini-Tutorial: Graphing a Scatterplot Using a Statistics Window |
Worksheet: TI-Nspire Mini-Tutorial: Graphing a Scatterplot Using a Statistics Window
This is part of a collection of math worksheets on the use of the TI-Nspire graphing calculator. |
Data Analysis |