Display Title
Definition--Direct Variation
Display Title
Direct Variation
Topic
Linear Functions
Definition
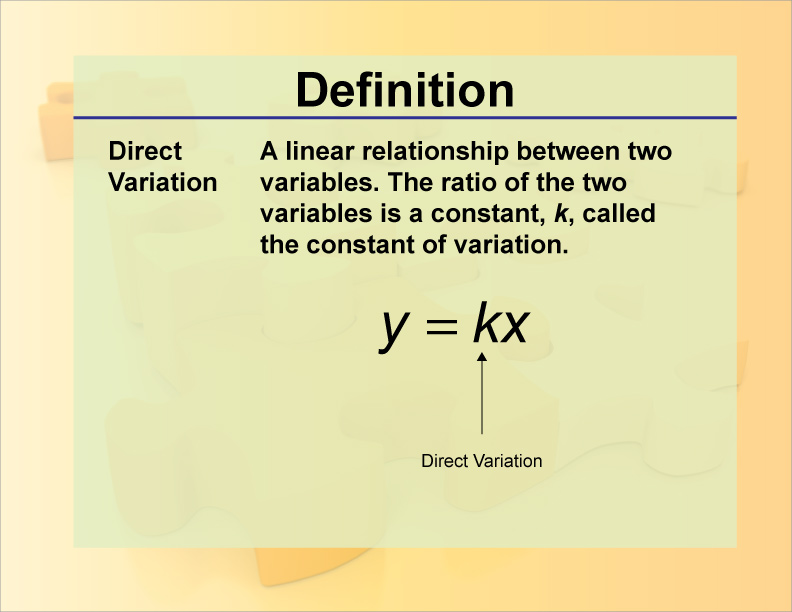
Direct variation describes a linear relationship between two variables where one variable is a constant multiple of the other, expressed as y = kx, where k is the constant of variation.
Description
Direct variation is a fundamental concept in linear functions, illustrating how one variable changes proportionally with another. The constant of variation, 𝑘 k, represents the rate of change.
In real-world scenarios, direct variation can model relationships such as speed and distance, where distance traveled varies directly with time at a constant speed. Understanding this concept is crucial in fields like physics and engineering.
In education, direct variation helps students grasp proportional relationships and their graphical representations. It lays the foundation for more complex functions and is essential for solving real-life problems involving proportionality.
For a complete collection of terms related to linear functions and equations click on this link: Linear Functions and Equations Collection
Direct Variation
The video was uploaded on 10/22/2022.
You can view the video here.
The video lasts for 1 minute and 16 seconds.
Video Transcript
A direct variation is a special type of linear function whose graph passes through the origin.
The equation of a direct variation is of the form y = k•x, where k is the constant of variation. It also happens to be the slope of the line.
This is an example of a direct variation where k is greater than 0.
This is an example of a direct variation where k is less than 0.
Direct variations can be used to model many real world phenomena.
For example, pushing or pulling a spring a certain distance is a way to measure the force on it.
The equation F = k•x is used to measure force on the spring based on how much it is stretched or compressed.
The value k is called the spring constant.
The direct variation between force and distance can be used to measure weight.
Scales for measuring weight use springs.
With the scale on the left, standing on it compresses the spring.
With the scale on the right, putting produce on it stretches the spring.
In both cases the amount the spring is compressed or stretched is a direct indicator of the weight.
There are many examples of direct variations in the real world.
Brief Review of Linear Functions
What Is a Function? A function is a one-to-one mapping of input values (the independent variable) to output values (the dependent variable). Click on this link to see a quick tutorial on what a function is. This slide show goes over the following key points:
For every input value (x), there is a unique output value, f(x).
Functions can be represented as equations, tables, and graphs.
A function machine is a useful visual representation of the input/output nature of functions.

Dependent/Independent Variables. When one variable depends on another, then it is the dependent variable. For example, the faster your speed, the farther you travel. Suppose that speed is represented by the variable s and the distance traveled is represented by the variable d.
Here’s how to describe the relationship between s and d:
- The faster the speed, the more distance traveled.
- Distance is dependent on speed.
- Distance is a function of speed.
- d = f(s)
When studying functions, make sure you are comfortable telling the difference between the independent variable and dependent variable. Get comfortable using function notation. To learn more about function notation, click on this link.
Domain and Range. A function shows the relationship between two variables, the independent variable and the dependent variable. The domain is the allowed values for the independent variable. The range is the allowed values for the dependent variable. The domain and range influence what the graph of the function looks like.
For a detailed review of what domain and range are, click on this link to learn more. You’ll see definitions of the terms domain and range, as well as examples of how to find the domain and range for given functions.
Multiple Representations of Functions. We mentioned previously that functions can be represented in different ways. In fact, any function can be represented by an equation, usually f(x) equal to some expression; a table; or a graph. For a detailed review of multiple representations of functions, click on this link, to see a slide show that includes examples of these multiple representations.
Slope-Intercept Form
The most important form of a linear function is the slope-intercept form.

Given the slope, m, and the y-intercept, b, for a linear function, you can easily construct the equation and graph of the linear function. To see examples of graphing linear functions in slope-intercept form, click on this link. This slide show also includes a video tutorial.
Point-Slope Form
Another method of finding the slope-intercept form involves using the point-slope form. In this case you are given the slope, m, of the line and one set of coordinates, (x, y), on the line. This is what the point-slope form looks like.

To see examples of deriving the linear function using the in point-slope form, click on this link. This slide show tutorial walks you through the process and provides several worked-out examples.
Slope Formula
First, let’s review the basics of slope. This is the slope formula:

Given two coordinates, the slope of the line connecting the two points is found using the slope formula.
The key to understanding this is the slope-intercept form for parallel and perpendicular lines. Review these definitions:


Basically, lines that are parallel have the same slope. Lines that are perpendicular have slopes that are negative reciprocals. Look at the following examples.
To see examples of finding the equations of parallel and perpendicular lines, click on the following links:
| Common Core Standards | CCSS.MATH.CONTENT.8.EE.B.6 |
|---|---|
| Grade Range | 6 - 12 |
| Curriculum Nodes |
Algebra • Linear Functions and Equations • Applications of Linear Functions |
| Copyright Year | 2013 |
| Keywords | defnitions, glossary term, direct variation |