Display Title
Definition--Measures of Central Tendency--Box-and-Whisker Plot
Display Title
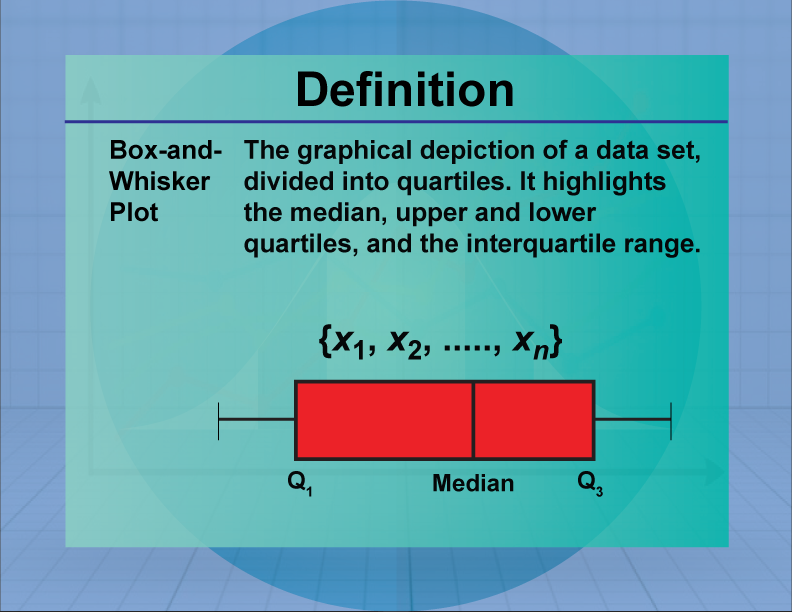
Box-and-Whisker Plot

Topic
Statistics
Definition
A box-and-whisker plot is a graphical representation of data that displays the distribution through quartiles.
Description
Box-and-whisker plots are useful for visualizing the spread and skewness of a data set, highlighting the median, quartiles, and potential outliers. They are particularly valuable in comparing distributions across different groups. In real-world applications, box plots are used in quality control processes and in analyzing survey data to identify trends and anomalies.
In math education, box-and-whisker plots help students understand data distribution and variability. They provide a visual tool for interpreting complex data sets, making it easier for students to grasp statistical concepts. Teachers often use box plots in lessons on data analysis, encouraging students to create and interpret these plots using real data.

For a complete collection of terms related to Measures of Central Tendency click on this link: Measures of Central Tendency Collection.
| Common Core Standards | CCSS.MATH.CONTENT.HSS.CP.B.6, CCSS.MATH.CONTENT.HSS.CP.B.7, CCSS.MATH.CONTENT.HSS.CP.B.8, CCSS.MATH.CONTENT.HSS.CP.B.9, CCSS.MATH.CONTENT.HSS.MD.A.2, CCSS.MATH.CONTENT.HSS.MD.B.5, CCSS.MATH.CONTENT.HSS.MD.B.5.B, CCSS.MATH.CONTENT.HSS.MD.B.6, CCSS.MATH.CONTENT.HSS.MD.B.7 |
|---|---|
| Grade Range | 6 - 10 |
| Curriculum Nodes |
Algebra • Probability and Data Analysis • Data Analysis |
| Copyright Year | 2013 |
| Keywords | data analysis, measures of central tendency, definitions, glossary term, statistics |