Display Title
Definition--Measures of Central Tendency--Histogram
Display Title
Histogram

Topic
Statistics
Definition
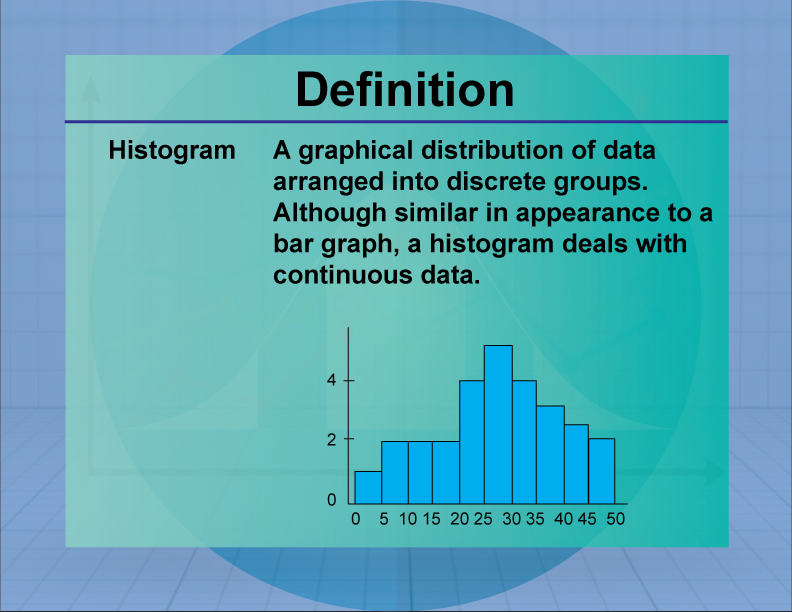
A histogram is a graphical representation of data distribution using bars of different heights.
Description
Histograms are used to visualize the frequency distribution of continuous data, making it easier to identify patterns and trends. They are widely used in fields such as economics, biology, and engineering to analyze data distributions and detect anomalies. In mathematics, histograms are essential for understanding probability distributions and statistical inference.
In educational settings, histograms are introduced as a tool for visualizing data, helping students develop skills in data interpretation and analysis. Students learn to create and analyze histograms using real-world data, gaining insights into the distribution and variability of data sets. Teachers use histograms to teach concepts of central tendency and dispersion, emphasizing their importance in data-driven decision-making.

For a complete collection of terms related to Measures of Central Tendency click on this link: Measures of Central Tendency Collection.
| Common Core Standards | CCSS.MATH.CONTENT.HSS.CP.B.6, CCSS.MATH.CONTENT.HSS.CP.B.7, CCSS.MATH.CONTENT.HSS.CP.B.8, CCSS.MATH.CONTENT.HSS.CP.B.9, CCSS.MATH.CONTENT.HSS.MD.A.2, CCSS.MATH.CONTENT.HSS.MD.B.5, CCSS.MATH.CONTENT.HSS.MD.B.5.B, CCSS.MATH.CONTENT.HSS.MD.B.6, CCSS.MATH.CONTENT.HSS.MD.B.7 |
|---|---|
| Grade Range | 6 - 10 |
| Curriculum Nodes |
Algebra • Probability and Data Analysis • Data Analysis |
| Copyright Year | 2021 |
| Keywords | data analysis, measures of central tendency, definitions, glossary term, statistics |