Display Title
Definition--Measures of Central Tendency--Interquartile Range
Display Title
Interquartile Range

Topic
Statistics
Definition
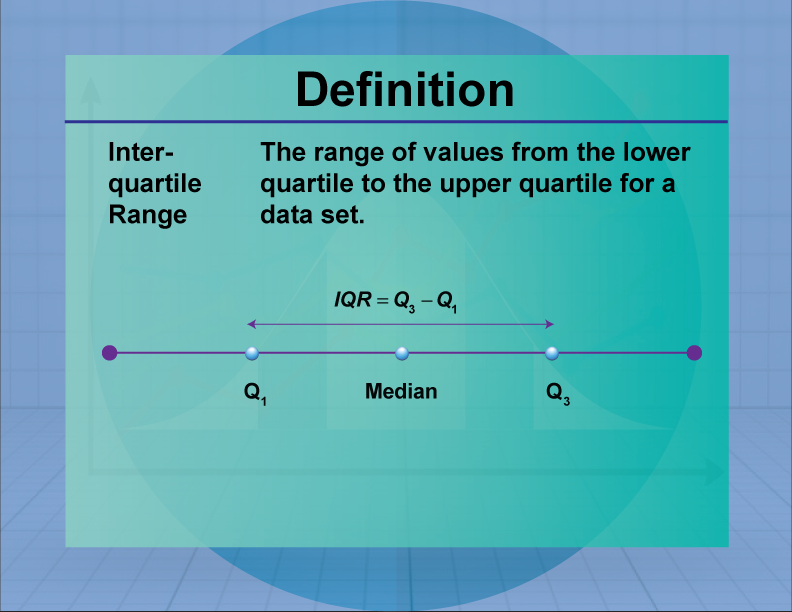
The interquartile range (IQR) is the range between the first and third quartiles, representing the middle 50% of a data set.
Description
The IQR is a measure of statistical dispersion, indicating the spread of the central portion of a data set. It is particularly useful for identifying outliers and understanding the variability of data. In real-world applications, the IQR is used in finance to assess investment risks and in quality control to monitor process stability.
In math education, the IQR is taught as part of lessons on data analysis and variability. Students learn to calculate and interpret the IQR using box-and-whisker plots, gaining insights into the distribution and spread of data. Teachers use the IQR to explain concepts of data variability and its implications for decision-making, emphasizing its role in statistical analysis.

For a complete collection of terms related to Measures of Central Tendency click on this link: Measures of Central Tendency Collection.
| Common Core Standards | CCSS.MATH.CONTENT.HSS.CP.B.6, CCSS.MATH.CONTENT.HSS.CP.B.7, CCSS.MATH.CONTENT.HSS.CP.B.8, CCSS.MATH.CONTENT.HSS.CP.B.9, CCSS.MATH.CONTENT.HSS.MD.A.2, CCSS.MATH.CONTENT.HSS.MD.B.5, CCSS.MATH.CONTENT.HSS.MD.B.5.B, CCSS.MATH.CONTENT.HSS.MD.B.6, CCSS.MATH.CONTENT.HSS.MD.B.7 |
|---|---|
| Grade Range | 6 - 10 |
| Curriculum Nodes |
Algebra • Probability and Data Analysis • Data Analysis |
| Copyright Year | 2021 |
| Keywords | data analysis, measures of central tendency, definitions, glossary term, statistics |