Display Title
Definition--Measures of Central Tendency--Quartile
Display Title
Quartile

Topic
Statistics
Definition
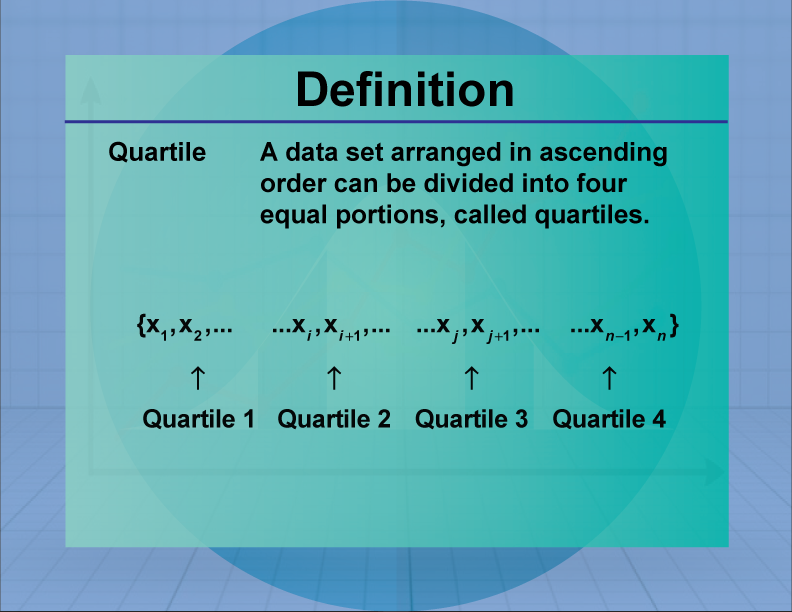
Quartiles divide a ranked data set into four equal parts.
Description
Quartiles are used to summarize data by dividing it into four parts, each representing a quarter of the data set. They provide insight into the spread and center of data, helping to identify the distribution and variability. Quartiles are used in box plots to visually represent data distribution, making them valuable in fields such as finance and research for analyzing data trends.
In educational settings, quartiles are introduced to help students understand data distribution and variability. Teachers use quartiles to explain how data can be divided and analyzed, emphasizing their importance in statistical analysis. Students often calculate quartiles as part of exercises on data interpretation, enhancing their understanding of data analysis techniques.

For a complete collection of terms related to Measures of Central Tendency click on this link: Measures of Central Tendency Collection.
| Common Core Standards | CCSS.MATH.CONTENT.HSS.CP.B.6, CCSS.MATH.CONTENT.HSS.CP.B.7, CCSS.MATH.CONTENT.HSS.CP.B.8, CCSS.MATH.CONTENT.HSS.CP.B.9, CCSS.MATH.CONTENT.HSS.MD.A.2, CCSS.MATH.CONTENT.HSS.MD.B.5, CCSS.MATH.CONTENT.HSS.MD.B.5.B, CCSS.MATH.CONTENT.HSS.MD.B.6, CCSS.MATH.CONTENT.HSS.MD.B.7 |
|---|---|
| Grade Range | 6 - 10 |
| Curriculum Nodes |
Algebra • Probability and Data Analysis • Data Analysis |
| Copyright Year | 2021 |
| Keywords | data analysis, measures of central tendency, definitions, glossary term, statistics, quartile |