Display Title
Definition--Measures of Central Tendency--Skewed Distribution
Display Title
Skewed Distribution

Topic
Statistics
Definition
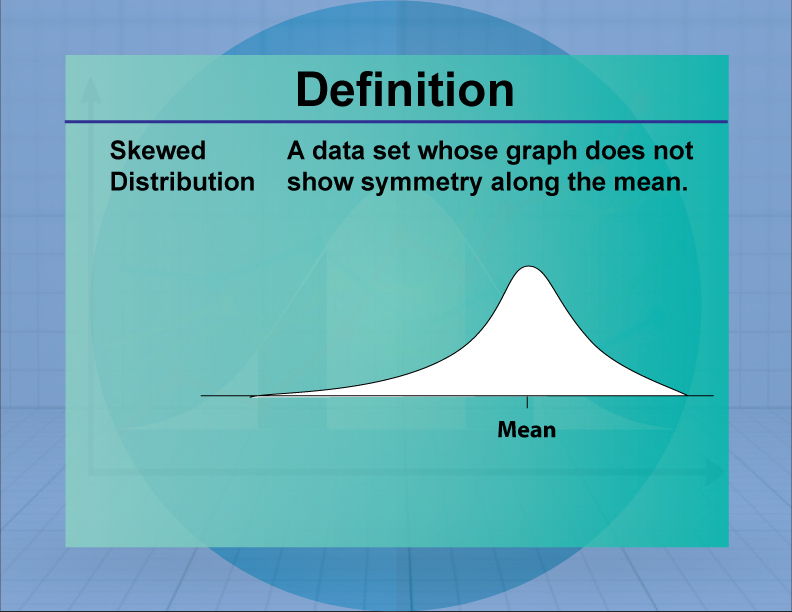
A skewed distribution is a probability distribution that is not symmetric, with data tending to cluster more on one side.
Description
Skewed distributions occur when data is not evenly distributed around the mean, resulting in a longer tail on one side. Skewness can be positive (right-skewed) or negative (left-skewed), affecting the interpretation of data and statistical measures such as the mean and median. Skewed distributions are common in real-world data, such as income levels and test scores, where extreme values can influence the overall distribution.
In math education, skewed distributions are introduced to help students understand data variability and the impact of outliers. Teachers use skewed distributions to explain how data can be asymmetrically distributed and the implications for statistical analysis. Students often analyze skewed data sets to develop skills in data interpretation and critical thinking.

For a complete collection of terms related to Measures of Central Tendency click on this link: Measures of Central Tendency Collection.
| Common Core Standards | CCSS.MATH.CONTENT.HSS.CP.B.6, CCSS.MATH.CONTENT.HSS.CP.B.7, CCSS.MATH.CONTENT.HSS.CP.B.8, CCSS.MATH.CONTENT.HSS.CP.B.9, CCSS.MATH.CONTENT.HSS.MD.A.2, CCSS.MATH.CONTENT.HSS.MD.B.5, CCSS.MATH.CONTENT.HSS.MD.B.5.B, CCSS.MATH.CONTENT.HSS.MD.B.6, CCSS.MATH.CONTENT.HSS.MD.B.7 |
|---|---|
| Grade Range | 6 - 10 |
| Curriculum Nodes |
Algebra • Probability and Data Analysis • Data Analysis |
| Copyright Year | 2021 |
| Keywords | data analysis, measures of central tendency, definitions, glossary term, statistics, skew |