Display Title
Definition--Measures of Central Tendency--Upper Quartile
Display Title
Upper Quartile

Topic
Statistics
Definition
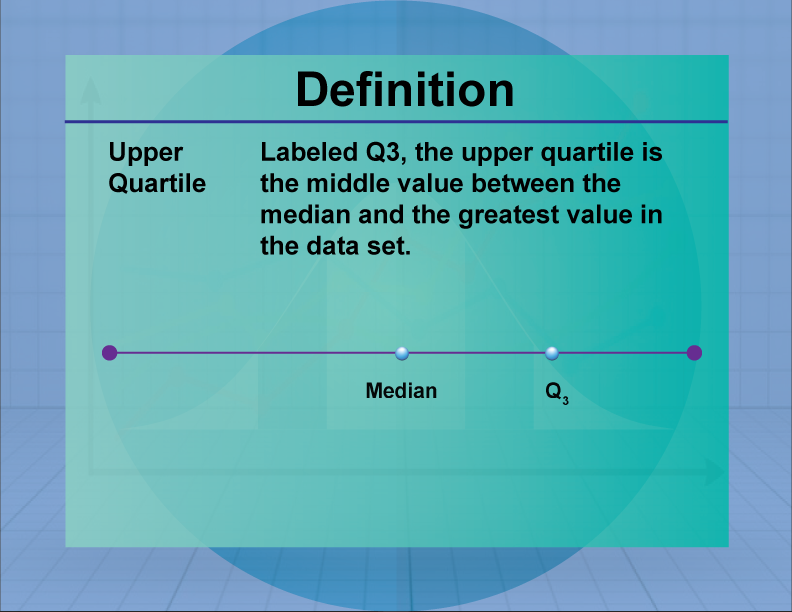
The upper quartile (Q3) is the median of the upper half of a data set, representing the 75th percentile.
Description
The upper quartile is a measure of position that indicates the value below which 75% of the data falls. It is used in conjunction with other quartiles to understand the distribution and spread of data. In real-world applications, the upper quartile is used in finance to assess investment performance and in education to evaluate student achievement levels.
In math education, the upper quartile is introduced as part of lessons on data analysis and quartiles. Students learn to calculate and interpret the upper quartile using data sets and box plots, gaining insights into data distribution and variability. Teachers use the upper quartile to explain concepts of data position and its implications for decision-making, emphasizing its role in statistical analysis.

For a complete collection of terms related to Measures of Central Tendency click on this link: Measures of Central Tendency Collection.
| Common Core Standards | CCSS.MATH.CONTENT.HSS.CP.B.6, CCSS.MATH.CONTENT.HSS.CP.B.7, CCSS.MATH.CONTENT.HSS.CP.B.8, CCSS.MATH.CONTENT.HSS.CP.B.9, CCSS.MATH.CONTENT.HSS.MD.A.2, CCSS.MATH.CONTENT.HSS.MD.B.5, CCSS.MATH.CONTENT.HSS.MD.B.5.B, CCSS.MATH.CONTENT.HSS.MD.B.6, CCSS.MATH.CONTENT.HSS.MD.B.7 |
|---|---|
| Grade Range | 6 - 10 |
| Curriculum Nodes |
Algebra • Probability and Data Analysis • Data Analysis |
| Copyright Year | 2021 |
| Keywords | data analysis, measures of central tendency, definitions, glossary term, statistics, quartile |