Display Title
Definition--Polynomial Concepts--Graphs of Polynomials
Display Title
Graphs of Polynomials

Topic
Polynomials
Definition
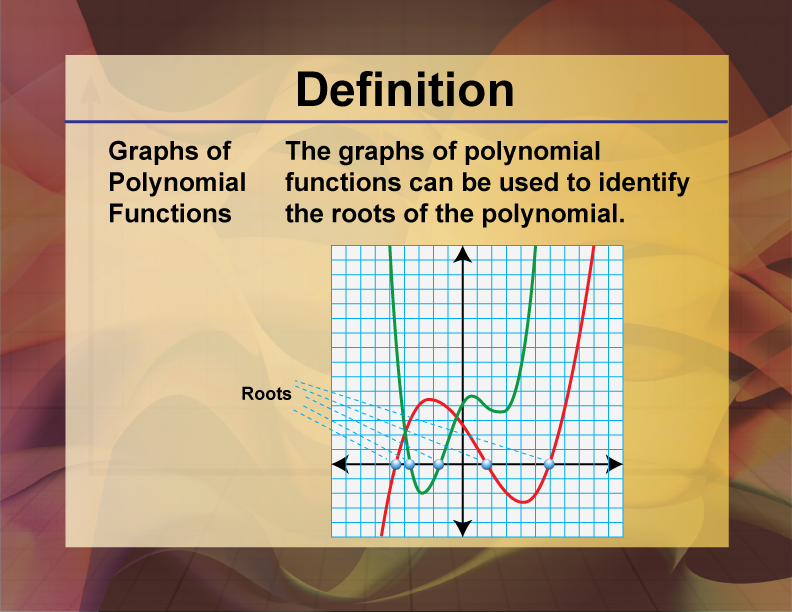
Graphs of polynomials are visual representations of polynomial functions on a coordinate plane.
Description
Graphs of polynomials provide a visual understanding of the behavior and properties of polynomial functions. These graphs depict the relationship between the independent variable and the dependent variable, showing how the polynomial function behaves across different values. Key features of polynomial graphs include intercepts, turning points, and end behavior.
Understanding the graphs of polynomials is crucial for analyzing and interpreting polynomial functions. It helps in identifying the roots, maximum and minimum points, and the overall shape of the function. Graphs also provide insights into the symmetry and periodicity of polynomials, which are important in various mathematical and scientific applications.
In practical applications, graphs of polynomials are used in physics, engineering, and economics to model and analyze real-world phenomena. They help in visualizing data, predicting trends, and solving complex problems involving polynomial relationships. Mastery of polynomial graphs enhances analytical skills and provides a deeper understanding of polynomial functions.
For a complete collection of terms related to polynomials click on this link: Polynomials Collection
| Common Core Standards | CCSS.MATH.CONTENT.HSA.APR.A.1, CCSS.MATH.CONTENT.HSA.APR.B.2, CCSS.MATH.CONTENT.HSA.APR.C.5, CCSS.MATH.CONTENT.HSA.APR.C.4, CCSS.MATH.CONTENT.HSA.APR.B.3, CCSS.MATH.CONTENT.HSF.IF.C.7.C |
|---|---|
| Grade Range | 8 - 12 |
| Curriculum Nodes |
Algebra • Polynomials • Polynomial Functions and Equations |
| Copyright Year | 2021 |
| Keywords | polynomials, monomials, definitions, glossary term, polynomial functions |