Display Title
Definition--Ratios, Proportions, and Percents Concepts--Visual Models for Percents
Display Title
Visual Models for Percents

Topic
Ratios, Proportions, and Percents
Definition
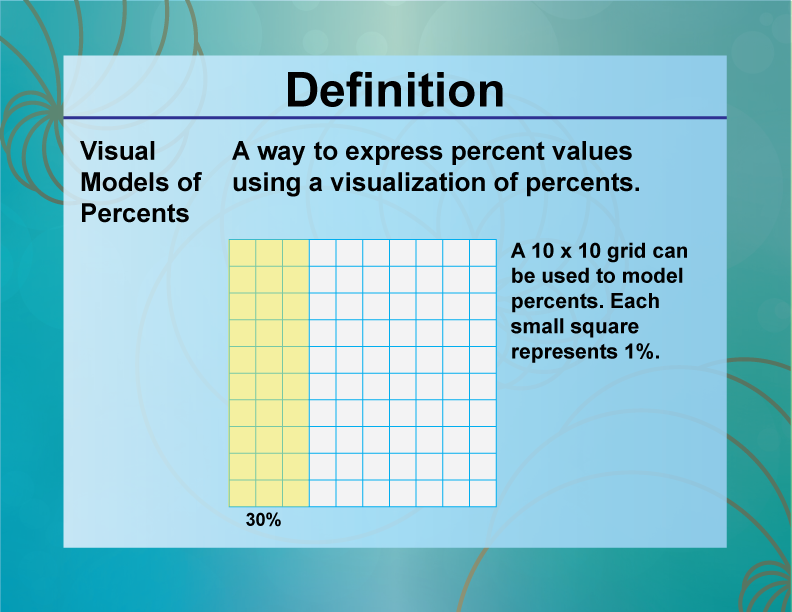
Visual models for percents are diagrams or illustrations that represent percentages to help visualize and understand them.
Description
Visual models for percents are useful tools in various fields, such as education, finance, and statistics, to represent data and make it more comprehensible. For example, pie charts and bar graphs are common visual models that help illustrate percentages and proportions effectively.
In math education, using visual models helps students grasp the concept of percentages and their applications. For instance, a pie chart can show how different portions of a whole relate to each other in percentage terms, making abstract concepts more concrete and understandable. This approach aids in developing a deeper understanding of percentages and their real-world relevance.
Teacher’s Script: "Imagine a pie chart where 25% of the chart is shaded. This visual model helps you see that 25% represents one-fourth of the whole."

For a complete collection of terms related to Ratios, Proportions, and Percents click on this link: Ratios, Proportions, and Percents Collection
| Common Core Standards | CCSS.MATH.CONTENT.6.RP.A.1, CCSS.MATH.CONTENT.6.RP.A.2, CCSS.MATH.CONTENT.6.RP.A.3, CCSS.MATH.CONTENT.7.RP.A.3, CCSS.MATH.CONTENT.HSG.SRT.A.1.B |
|---|---|
| Grade Range | 6 - 8 |
| Curriculum Nodes |
Algebra • Ratios, Proportions, and Percents • Percents |
| Copyright Year | 2021 |
| Keywords | ratios, Percent, definitions, glossary terms, rates, proportions |