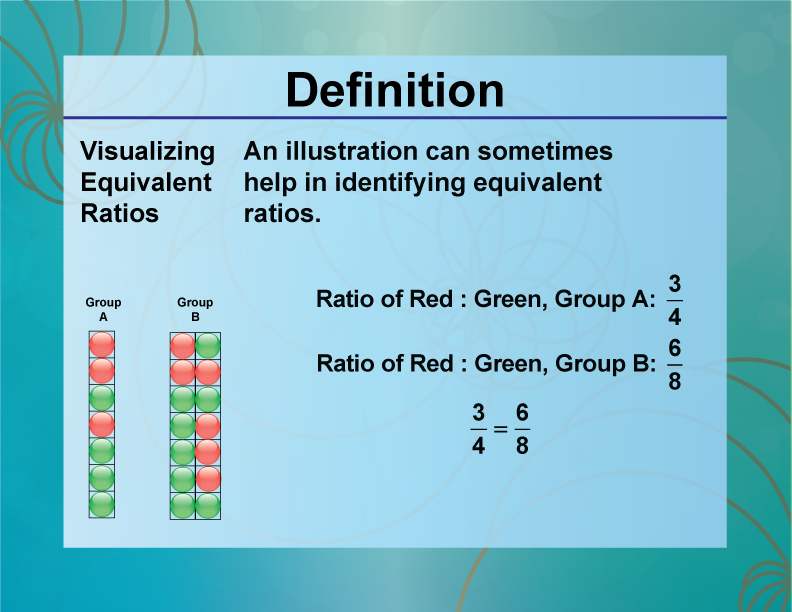
Display Title
Definition--Ratios, Proportions, and Percents Concepts--Visualizing Equivalent Ratios
Display Title
Visualizing Equivalent Ratios

Topic
Ratios, Proportions, and Percents
Definition
Visualizing equivalent ratios involves using diagrams or models to show that two ratios are equivalent.
Description
Visualizing equivalent ratios is important in fields such as mathematics and engineering, where understanding proportional relationships is crucial. For example, using a double number line or a ratio table can help illustrate that the ratios 2:3 and 4:6 are equivalent.
In math education, visualizing equivalent ratios helps students understand the concept of proportionality and how different ratios can represent the same relationship. For instance, a ratio table can show that multiplying both terms of the ratio 1:2 by 2 results in the equivalent ratio 2:4. This visual approach aids in developing a deeper understanding of ratios and their applications.
Teacher’s Script: "If you have a ratio of 1:3, you can create an equivalent ratio by multiplying both terms by the same number. For example, multiplying both terms by 2 gives you the equivalent ratio 2:6."

For a complete collection of terms related to Ratios, Proportions, and Percents click on this link: Ratios, Proportions, and Percents Collection
| Common Core Standards | CCSS.MATH.CONTENT.6.RP.A.1, CCSS.MATH.CONTENT.6.RP.A.2, CCSS.MATH.CONTENT.6.RP.A.3, CCSS.MATH.CONTENT.7.RP.A.3, CCSS.MATH.CONTENT.HSG.SRT.A.1.B, CCSS.MATH.CONTENT.6.RP.A.3.A |
|---|---|
| Grade Range | 6 - 8 |
| Curriculum Nodes |
Algebra • Ratios, Proportions, and Percents • Ratios and Rates |
| Copyright Year | 2021 |
| Keywords | ratios, Percent, definitions, glossary terms, rates, proportions, visualizing ratios |