Display Title
Definition--Statistics and Probability Concepts--Relative Frequency Table
Display Title
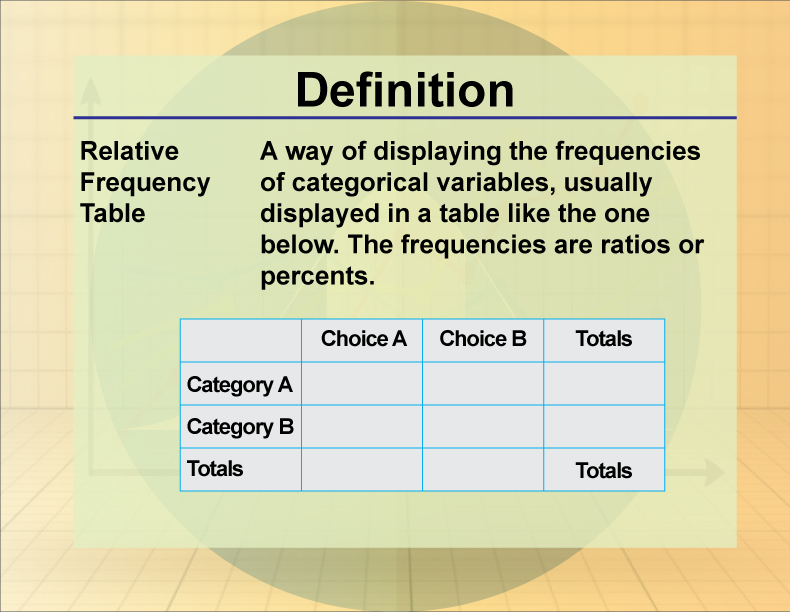
Relative Frequency Table

Topic
Statistics and Probability
Definition
A relative frequency table displays the proportion of total occurrences for each category of data.
Description
Relative frequency tables are important in statistics as they summarize data in a way that makes it easy to analyze proportions and patterns within datasets. These tables allow for quick comparisons of different categories based on their frequency relative to the total.
They are often employed in survey results to convey the distribution of responses or occurrences of events such as preferences in a target demographic. Understanding how to create and interpret relative frequency tables is essential for students as they tackle statistical analysis in real-world situations.
This insight helps strengthen their analytical skills while encouraging critical thinking during data interpretation.

For a complete collection of terms related to Probability and Statistics click on this link: Probability and Statistics Collection.
| Common Core Standards | CCSS.MATH.CONTENT.6.SP.B.4, CCSS.MATH.CONTENT.6.SP.A.2, CCSS.MATH.CONTENT.HSS.ID.A.1, CCSS.MATH.CONTENT.HSS.ID.A.2, CCSS.MATH.CONTENT.HSS.ID.A.3, CCSS.MATH.CONTENT.HSS.ID.A.4 |
|---|---|
| Grade Range | 8 - 12 |
| Curriculum Nodes |
Algebra • Probability and Data Analysis • Data Analysis |
| Copyright Year | 2020 |
| Keywords | statistics, probability, relative frequency |