Display Title
Definition--Statistics and Probability Concepts--Scatterplot
Display Title
Definition--Statistics and Probability Concepts--Scatterplot
Scatterplot

Topic
Statistics and Probability
Definition
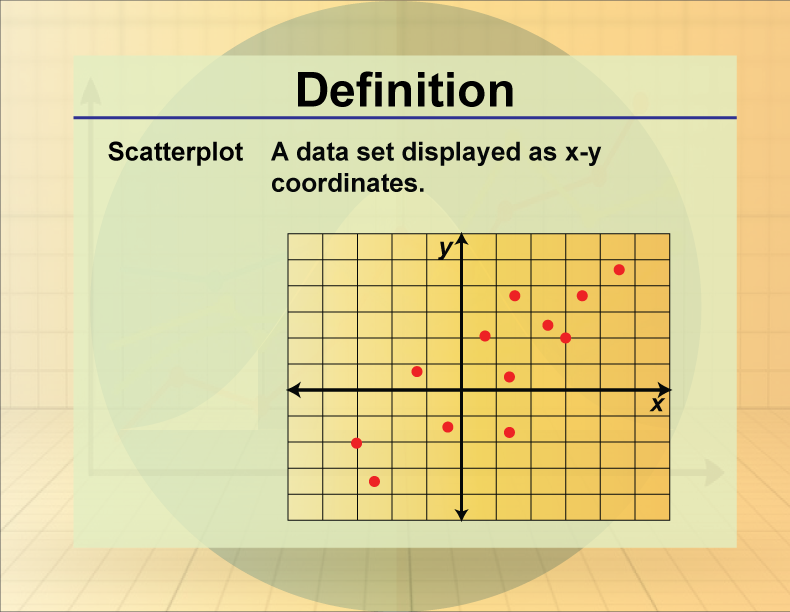
A scatterplot is a graphical representation of the relationship between two numerical variables.
Description
Scatterplots are essential tools in statistics for visualizing the correlation between two variables. They are widely used in fields like economics and biology to identify trends and relationships in data.
For students, understanding scatterplots is important for interpreting data visually and analyzing the strength and direction of relationships between variables. This skill is crucial for developing their ability to conduct statistical analyses and draw meaningful conclusions from data.
For a complete collection of terms related to Probability and Statistics click on this link: Probability and Statistics Collection.
| Common Core Standards | CCSS.MATH.CONTENT.6.SP.B.4, CCSS.MATH.CONTENT.6.SP.A.2, CCSS.MATH.CONTENT.HSS.ID.A.1, CCSS.MATH.CONTENT.HSS.ID.A.2, CCSS.MATH.CONTENT.HSS.ID.A.3, CCSS.MATH.CONTENT.HSS.ID.A.4 |
|---|---|
| Grade Range | 6 - 12 |
| Curriculum Nodes |
Algebra • Probability and Data Analysis • Data Analysis |
| Copyright Year | 2013 |
| Keywords | scatterplot, data analysis, data graphs, definitions, glossary term |