Display Title
Math Clip Art--Applications of Linear and Quadratic Functions: Speed and Acceleration 05
Display Title
Math Clip Art--Applications of Linear and Quadratic Functions: Speed and Acceleration 05

Topic
Quadratics
Description
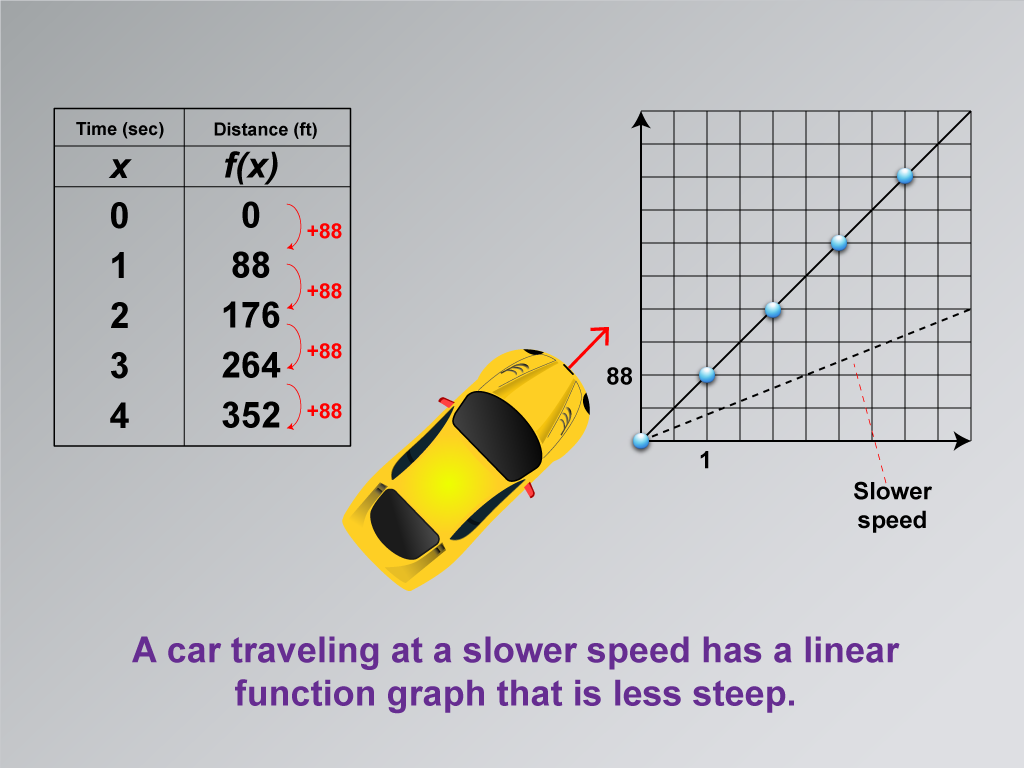
This image is a variation showing time and distance data with a graph that includes a dotted line labeled "Slower speed." The graph illustrates how different speeds affect the steepness of linear function graphs. This visual comparison helps students see how speed variations are represented mathematically.
Using math clip art allows students to visualize differences in speed through graphical representations, aiding comprehension of linear functions' applications.
Teacher's Script: "Notice how the graph changes with different speeds. Let's explore how these changes affect our understanding of motion."
For a complete collection of math clip art related to Applications of Linear and Quadratic Functions click on this link: Applications of Linear and Quadratic Functions Collection.
| Common Core Standards | CCSS.MATH.CONTENT.8.F.A.2, CCSS.MATH.CONTENT.8.F.A.3, CCSS.MATH.CONTENT.HSF.LE.A.1.A |
|---|---|
| Grade Range | 8 - 10 |
| Curriculum Nodes |
Algebra • Linear Functions and Equations • Graphs of Linear Functions • Quadratic Functions and Equations • Graphs of Quadratic Functions |
| Copyright Year | 2021 |
| Keywords | linear functions, quadratic functions |