Display Title
Math Clip Art--Applications of Linear and Quadratic Functions: Speed and Acceleration 11
Display Title
Math Clip Art--Applications of Linear and Quadratic Functions: Speed and Acceleration 11

Topic
Quadratics
Description
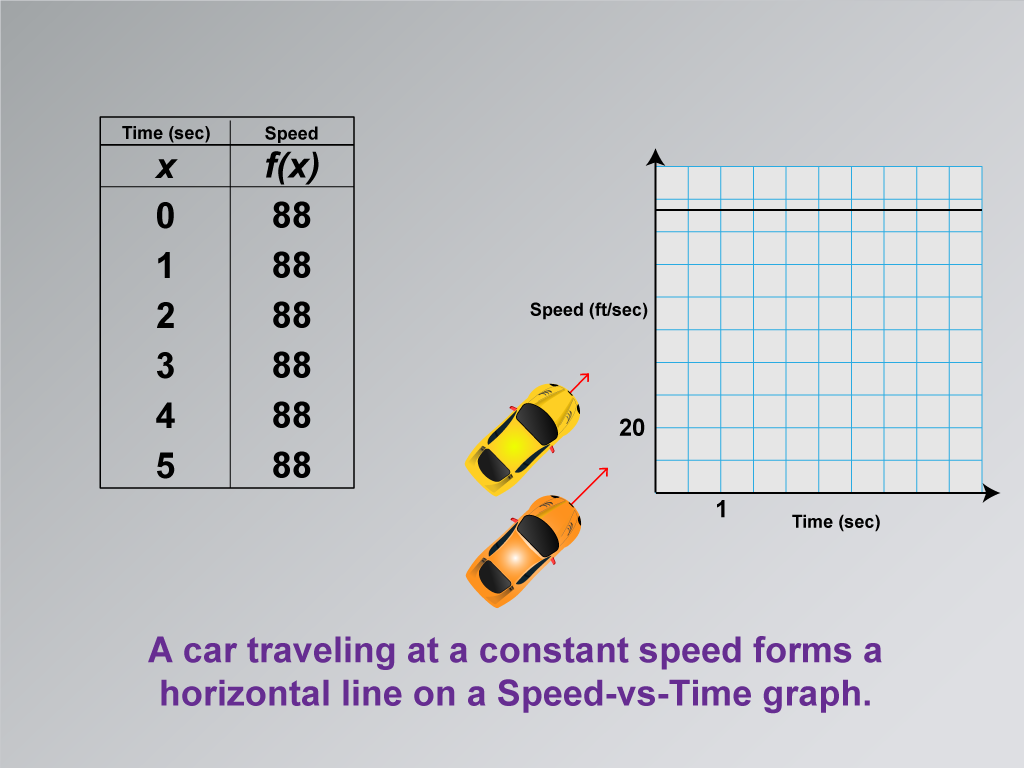
This image shows a graph and data for a constant speed scenario. The graph helps students understand how different speeds are represented in mathematical models, with linear sections indicating constant speed and curved sections showing acceleration or deceleration.
Math clip art like this is essential for teaching as it visually differentiates between linear and quadratic functions, providing clarity in understanding real-world applications.
Teacher's Script: "Look at how the graph stays flat for a constant speed. What do changes in a graph tell us about the car's speed? Let's explore the math behind these movements."
For a complete collection of math clip art related to Applications of Linear and Quadratic Functions click on this link: Applications of Linear and Quadratic Functions Collection.
| Common Core Standards | CCSS.MATH.CONTENT.8.F.A.2, CCSS.MATH.CONTENT.8.F.A.3, CCSS.MATH.CONTENT.HSF.LE.A.1.A |
|---|---|
| Grade Range | 8 - 10 |
| Curriculum Nodes |
Algebra • Linear Functions and Equations • Graphs of Linear Functions • Quadratic Functions and Equations • Graphs of Quadratic Functions |
| Copyright Year | 2021 |
| Keywords | linear functions, quadratic functions |