Display Title
Math Clip Art--Applications of Linear and Quadratic Functions: Speed and Acceleration 14
Display Title
Math Clip Art--Applications of Linear and Quadratic Functions: Speed and Acceleration 14
Math Clip Art--Applications of Linear and Quadratic Functions: Speed and Acceleration 14

Topic
Quadratics
Description
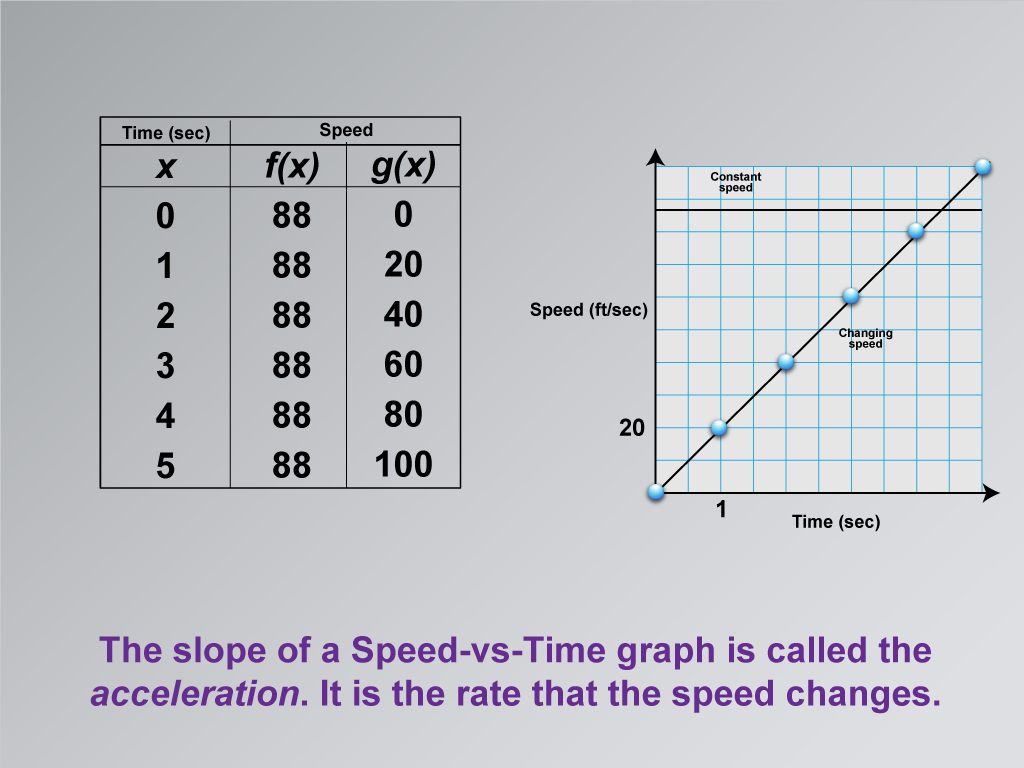
This image includes a table with time (x) and speed (f(x) and g(x)). The graph shows constant and changing speeds, emphasizing the slope. The slope of a Speed-vs-Time graph is called acceleration, which is the rate that speed changes.
The use of math clip art helps students visualize how acceleration is represented graphically, aiding in understanding real-world applications.
Teacher's Script: "Notice the slope of these lines. How does it show acceleration? Let's explore what this means for speed changes."
For a complete collection of math clip art related to Applications of Linear and Quadratic Functions click on this link: Applications of Linear and Quadratic Functions Collection.
| Common Core Standards | CCSS.MATH.CONTENT.8.F.A.2, CCSS.MATH.CONTENT.8.F.A.3, CCSS.MATH.CONTENT.HSF.LE.A.1.A |
|---|---|
| Grade Range | 8 - 10 |
| Curriculum Nodes |
Algebra • Linear Functions and Equations • Graphs of Linear Functions • Quadratic Functions and Equations • Graphs of Quadratic Functions |
| Copyright Year | 2021 |
| Keywords | linear functions, quadratic functions |