Display Title
Math Clip Art--Applications of Linear and Quadratic Functions: Speed and Acceleration 18
Display Title
Math Clip Art--Applications of Linear and Quadratic Functions: Speed and Acceleration 18
Math Clip Art--Applications of Linear and Quadratic Functions: Speed and Acceleration 18

Topic
Quadratics
Description
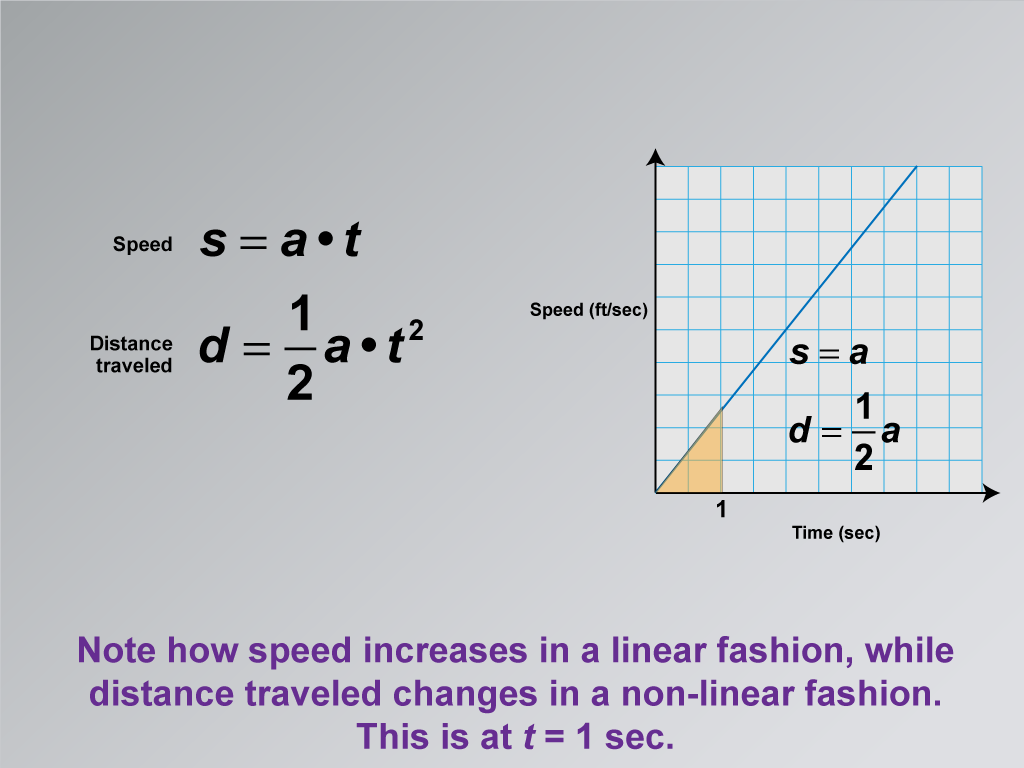
This image shows a graph with speed on the y-axis and time on the x-axis. The equations for speed and distance traveled are given as s = a⋅t and d = 1/2at2. The graph illustrates how speed increases linearly, while distance traveled follows a non-linear path.
Math clip art like this helps students understand the difference between linear and quadratic relationships in real-world contexts.
Teacher's Script: "Notice how speed increases linearly while distance grows non-linearly. What does this tell us about motion?"
For a complete collection of math clip art related to Applications of Linear and Quadratic Functions click on this link: Applications of Linear and Quadratic Functions Collection.
| Common Core Standards | CCSS.MATH.CONTENT.8.F.A.2, CCSS.MATH.CONTENT.8.F.A.3, CCSS.MATH.CONTENT.HSF.LE.A.1.A |
|---|---|
| Grade Range | 8 - 10 |
| Curriculum Nodes |
Algebra • Linear Functions and Equations • Graphs of Linear Functions • Quadratic Functions and Equations • Graphs of Quadratic Functions |
| Copyright Year | 2021 |
| Keywords | linear functions, quadratic functions |