Display Title
Math Clip Art--Applications of Linear Functions--Business Model 4
Display Title
Math Clip Art--Applications of Linear Functions--Business Model 4

Topic
Linear Functions
Description
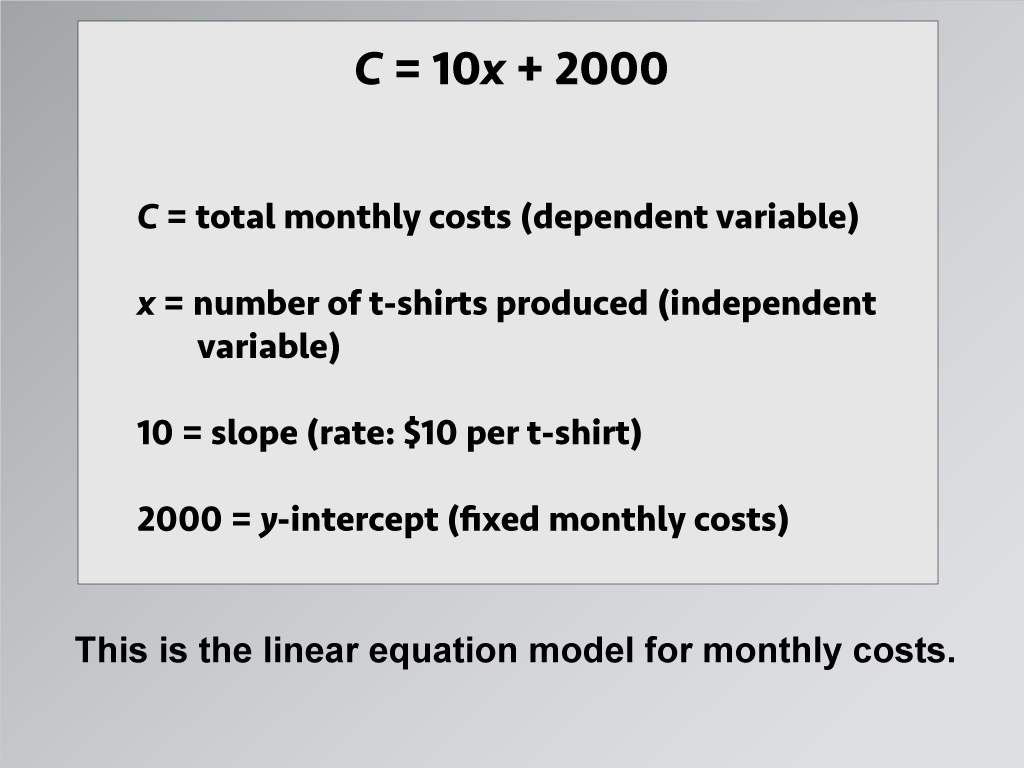
This math clip art is a crucial part of the series on applications of linear functions in business modeling. It presents the equation C = 10x + 2000, which encapsulates the business model we've been building. Here, C represents the total monthly costs, x is the number of t-shirts produced, 10 is the cost per shirt, and 2000 represents the fixed monthly costs.
Such visual representations are invaluable in mathematics education. They provide a clear, concise way to present complex information, helping students connect abstract equations with real-world scenarios. By incorporating these images into lessons on linear functions, teachers can effectively demonstrate how mathematical models are constructed and applied in business contexts.
Teacher's Script: Let's analyze this equation, class. Can you identify what each part represents in our t-shirt business? How does this equation reflect what we've learned about fixed costs and per-unit costs? Think about how changing different parts of this equation would affect our business model.
For a complete collection of math clip art related to Applications of Linear Functions click on this link: Applications of Linear Functions: Business Models Collection.
| Common Core Standards | CCSS.MATH.CONTENT.8.F.A.2, CCSS.MATH.CONTENT.8.F.A.3, CCSS.MATH.CONTENT.HSF.LE.A.1.A |
|---|---|
| Grade Range | 8 - 10 |
| Curriculum Nodes |
Algebra • Linear Functions and Equations • Applications of Linear Functions |
| Copyright Year | 2024 |
| Keywords | applications of linear functions |