Display Title
Math Clip Art--Applications of Linear Functions: Cost vs. Time 02
Display Title
Math Clip Art--Applications of Linear Functions: Cost vs. Time 02

Topic
Linear Functions
Description
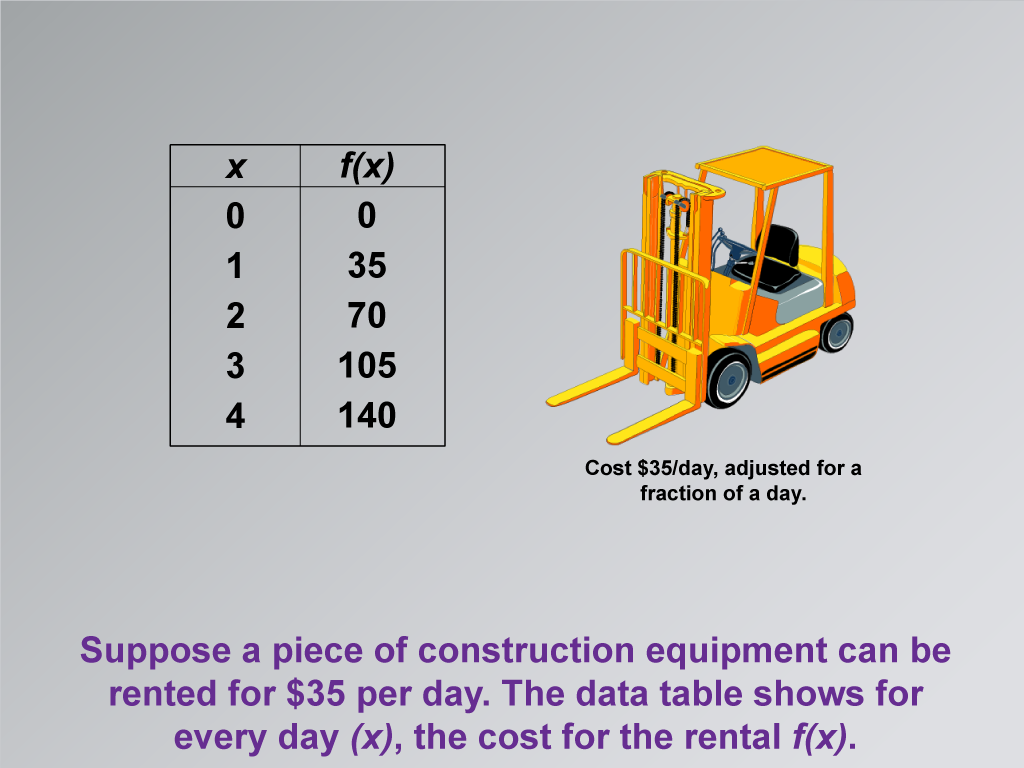
This math clip art image is the second in a series exploring applications of linear functions, focusing on building a linear function model for equipment rental costs. The image presents a practical scenario involving the rental of construction equipment, illustrating how linear functions can model real-world situations. It features construction equipment alongside a data table, demonstrating the relationship between the number of rental days and the total cost.
The image introduces a specific example where a piece of construction equipment can be rented for $35 per day. The accompanying data table shows how the cost function f(x) changes with each day (x) of rental. This visual representation helps students connect the abstract concept of a linear function to a tangible, real-life application. It effectively demonstrates how the daily rate translates into a linear relationship between time and cost.
Using such math clip art in teaching is invaluable for making abstract mathematical concepts more accessible and relatable to students. These visuals can be easily incorporated into lessons on Linear Functions, providing a concrete example that helps students understand the components of linear equations, such as slope (daily rate) and variables (days and cost). This approach not only enhances comprehension but also demonstrates the practical utility of mathematics in everyday scenarios, potentially increasing student engagement and interest in the subject.
Teacher's Script
Let's examine this image showing a construction equipment rental scenario. Notice how the cost increases by $35 for each day. This is a perfect example of a linear function in action. As we analyze the data table, think about how we can represent this relationship using a linear equation. How does the daily rate of $35 relate to the slope of our function? And what would our x and y variables represent in this real-world context?
For a complete collection of math clip art related to Applications of Linear Functions click on this link: Applications of Linear Functions: Cost vs. Time Collection.
| Common Core Standards | CCSS.MATH.CONTENT.8.F.A.2, CCSS.MATH.CONTENT.8.F.A.3, CCSS.MATH.CONTENT.HSF.LE.A.1.A |
|---|---|
| Grade Range | 8 - 10 |
| Curriculum Nodes |
Algebra • Linear Functions and Equations • Graphs of Linear Functions • Slope-Intercept Form |
| Copyright Year | 2021 |
| Keywords | linear functions |