Display Title
Math Clip Art--Applications of Linear Functions: Cost vs. Time 03
Display Title
Math Clip Art--Applications of Linear Functions: Cost vs. Time 03

Topic
Linear Functions
Description
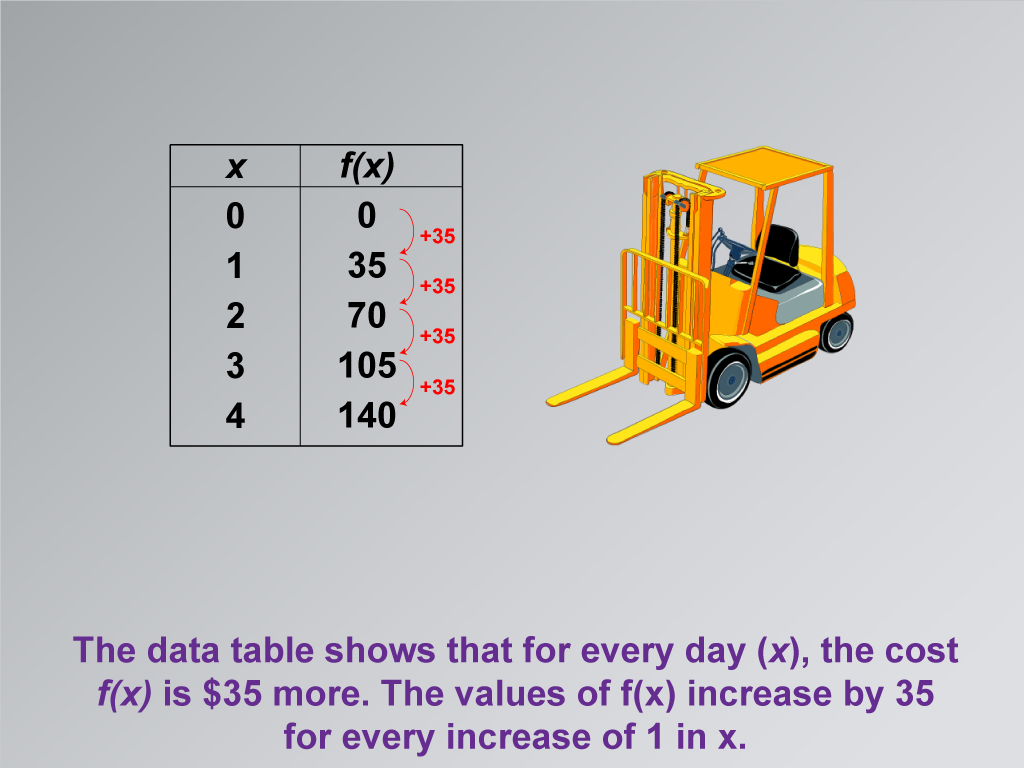
This math clip art image is the third in a series dedicated to illustrating applications of linear functions, specifically focusing on building a linear function model for equipment rental costs. The image continues the construction equipment rental scenario, emphasizing the linear relationship between rental duration and cost. It features a data table that clearly demonstrates how the cost function f(x) increases by $35 for each additional day of rental.
The visual aid effectively highlights a key characteristic of linear functions: constant rate of change. By showing that the values of f(x) increase by 35 for every increase of 1 in x, the image helps students grasp the concept of slope in a practical context. This representation bridges the gap between abstract mathematical concepts and real-world applications, making it easier for students to understand and remember the principles of linear functions.
Incorporating such math clip art into lessons on Linear Functions can significantly enhance student comprehension. These visuals provide a tangible reference point for discussions about rate of change, slope, and the relationship between variables in a linear equation. By presenting mathematical concepts in a relatable, real-world scenario, educators can make the learning process more engaging and memorable. This approach not only aids in better retention of the material but also encourages critical thinking about how mathematics applies to everyday situations.
Teacher's Script
Take a close look at this data table. Notice how the cost increases by exactly $35 each day. This consistent increase is what makes this a linear function. Can you see how this relates to the slope of a line? Let's think about how we could graph this data. What would the slope be? How could we use this information to write an equation for this linear function?
For a complete collection of math clip art related to Applications of Linear Functions click on this link: Applications of Linear Functions: Cost vs. Time Collection.
| Common Core Standards | CCSS.MATH.CONTENT.8.F.A.2, CCSS.MATH.CONTENT.8.F.A.3, CCSS.MATH.CONTENT.HSF.LE.A.1.A |
|---|---|
| Grade Range | 8 - 10 |
| Curriculum Nodes |
Algebra • Linear Functions and Equations • Graphs of Linear Functions • Slope-Intercept Form |
| Copyright Year | 2021 |
| Keywords | linear functions |