Display Title
Math Clip Art--Applications of Linear Functions: Cost vs. Time 04
Display Title
Math Clip Art--Applications of Linear Functions: Cost vs. Time 04

Topic
Linear Functions
Description
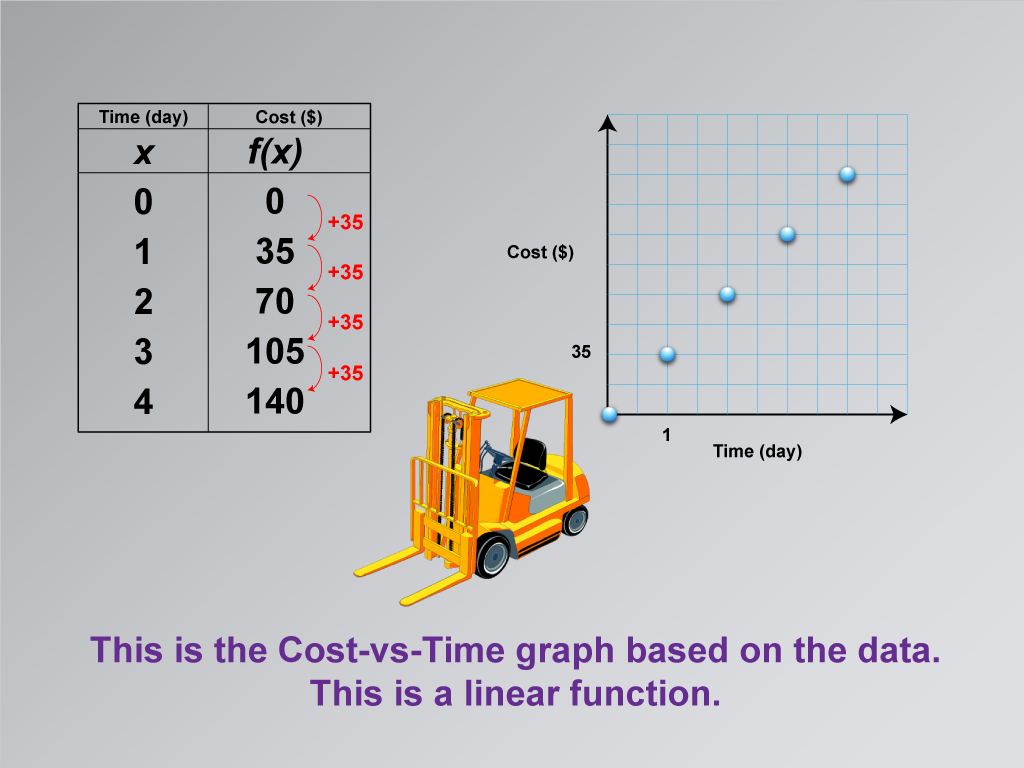
This math clip art image is the fourth in a series exploring applications of linear functions, focusing on building a linear function model for equipment rental costs. The image presents a significant step in understanding linear functions by introducing a graphical representation of the cost-versus-time relationship. It features construction equipment alongside a data table and a graph, illustrating how the tabular data translates into a visual representation.
The graph shown in the image displays a series of points, each corresponding to the daily rental cost over time. This visual aid effectively demonstrates how the linear relationship between time and cost, previously shown in tabular form, appears when plotted on a coordinate plane. The linear pattern of the points reinforces the concept of a constant rate of change, a key characteristic of linear functions.
Using such math clip art in teaching linear functions is invaluable for helping students visualize abstract mathematical concepts. This image bridges the gap between numerical data and graphical representation, allowing students to see the direct correlation between the two. Incorporating these visuals into lessons can significantly enhance student understanding of how to interpret and create graphs of linear functions. It provides a concrete example of how real-world data can be represented mathematically, making the learning process more engaging and relatable.
Teacher's Script
Now, let's look at how our rental cost data appears on a graph. Each point on this graph represents a day and its corresponding cost. Notice how these points form a straight line pattern. This is what we mean when we say it's a linear function. Can you see how the graph relates to the data table we looked at earlier? Think about what the slope of this line represents in terms of our rental scenario.
For a complete collection of math clip art related to Applications of Linear Functions click on this link: Applications of Linear Functions: Cost vs. Time Collection.
| Common Core Standards | CCSS.MATH.CONTENT.8.F.A.2, CCSS.MATH.CONTENT.8.F.A.3, CCSS.MATH.CONTENT.HSF.LE.A.1.A |
|---|---|
| Grade Range | 8 - 10 |
| Curriculum Nodes |
Algebra • Linear Functions and Equations • Graphs of Linear Functions • Slope-Intercept Form |
| Copyright Year | 2021 |
| Keywords | linear functions |