Display Title
Math Clip Art--Applications of Linear Functions: Cost vs. Time 05
Display Title
Math Clip Art--Applications of Linear Functions: Cost vs. Time 05

Topic
Linear Functions
Description
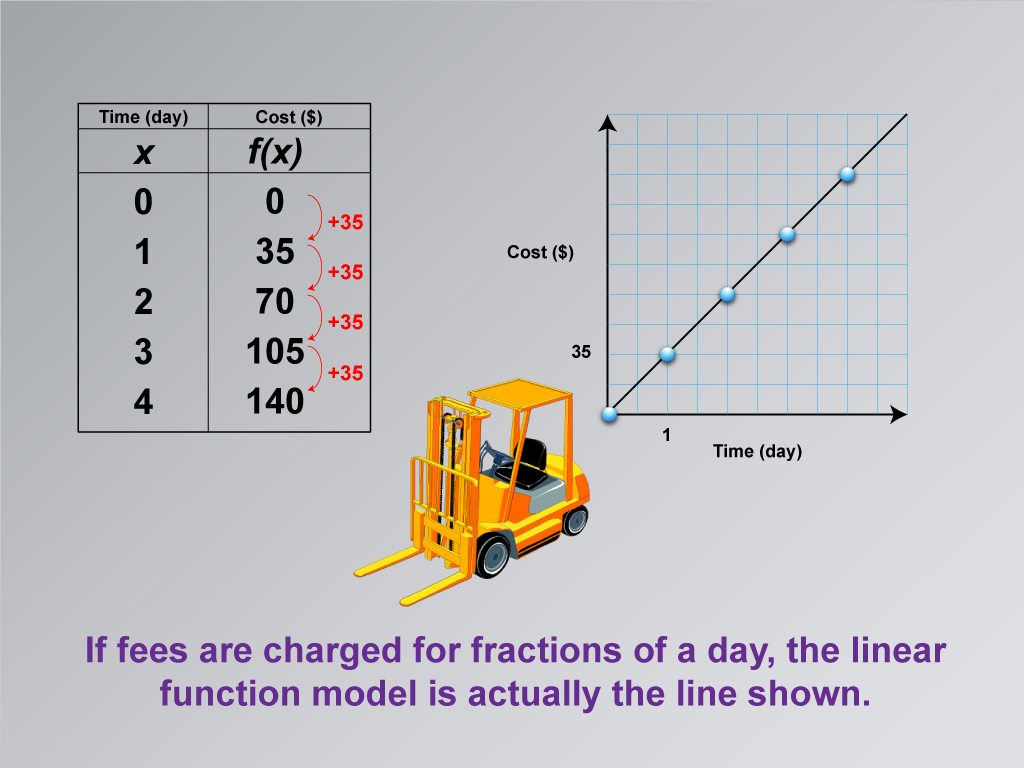
This math clip art image is the fifth in a series dedicated to illustrating applications of linear functions, specifically focusing on building a linear function model for equipment rental costs. The image expands on the previous graph by introducing a continuous line connecting the data points, representing a more realistic model where fees can be charged for fractions of a day. It features construction equipment alongside a data table and a graph with a solid line passing through the plotted points.
This visual aid effectively demonstrates the transition from discrete data points to a continuous linear function. By showing a solid line, the image helps students understand that the linear relationship between time and cost applies not just to whole days, but to any point in time. This representation reinforces the concept of continuity in linear functions and introduces the idea of interpolation – finding values between known data points.
Incorporating such math clip art into lessons on Linear Functions can significantly enhance student comprehension of abstract mathematical concepts. The image provides a concrete, real-world example of how linear functions can model continuous relationships. It helps students visualize the connection between equations, graphs, and real-life scenarios, making the learning process more engaging and relatable. This approach not only aids in better retention of the material but also encourages critical thinking about how mathematics applies to practical situations where values may not always fall neatly into whole numbers.
Teacher's Script
Look closely at this graph. Notice how we've now connected the points with a solid line. This line represents our linear function model for rental costs. It shows that we can calculate the cost for any amount of time, not just whole days. How do you think this might be useful in real-world situations? Can you estimate the cost for renting the equipment for 2.5 days using this graph?
For a complete collection of math clip art related to Applications of Linear Functions click on this link: Applications of Linear Functions: Cost vs. Time Collection.
| Common Core Standards | CCSS.MATH.CONTENT.8.F.A.2, CCSS.MATH.CONTENT.8.F.A.3, CCSS.MATH.CONTENT.HSF.LE.A.1.A |
|---|---|
| Grade Range | 8 - 10 |
| Curriculum Nodes |
Algebra • Linear Functions and Equations • Graphs of Linear Functions • Slope-Intercept Form |
| Copyright Year | 2021 |
| Keywords | linear functions |