Display Title
Math Clip Art--Applications of Linear Functions: Cost vs. Time 08
Display Title
Math Clip Art--Applications of Linear Functions: Cost vs. Time 08

Topic
Linear Functions
Description
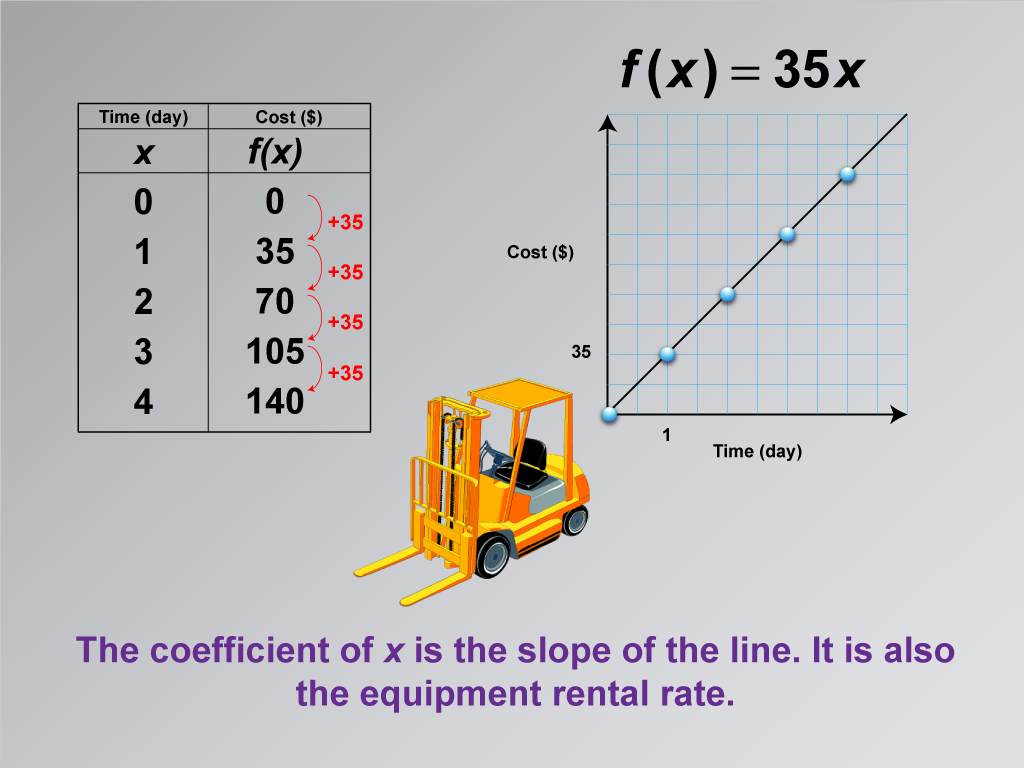
This math clip art image is the eighth in a series exploring applications of linear functions, focusing on building a linear function model for equipment rental costs. The image emphasizes the relationship between the coefficient of x in the linear equation, the slope of the line in the graph, and the real-world rental rate. It continues to feature the construction equipment scenario, providing a concrete context for understanding these mathematical concepts.
The caption explicitly states that the coefficient of x is both the slope of the line and the equipment rental rate. This connection is crucial for understanding how the mathematical representation relates to the real-world scenario. It reinforces the idea that in a linear function, the coefficient of x (in this case, 35) represents the rate of change, which in this context is the daily rental rate of $35. This visual aid effectively demonstrates how the abstract concept of slope in a linear equation directly corresponds to a tangible value in the real world.
Incorporating such math clip art into lessons on Linear Functions can significantly enhance student comprehension of the relationships between different representations of linear functions. This image bridges the gap between algebraic, graphical, and real-world representations, allowing students to see how the same information (the rental rate) is reflected in each form. By presenting these connections in a relatable, real-world scenario, educators can make the learning process more engaging and memorable, helping students to develop a deeper understanding of how mathematical concepts apply to practical situations.
Teacher's Script
Take a close look at how the coefficient of x in our equation relates to both the graph and our rental scenario. The number 35 appears as the coefficient in our equation, the slope of our line, and the daily rental rate. Can you explain why this single number is so important in all three contexts? How does this help us understand the relationship between the equation of a line and its graph? Can you think of other real-world scenarios where the slope of a line might represent a rate in a similar way?
For a complete collection of math clip art related to Applications of Linear Functions click on this link: Applications of Linear Functions: Cost vs. Time Collection.
| Common Core Standards | CCSS.MATH.CONTENT.8.F.A.2, CCSS.MATH.CONTENT.8.F.A.3, CCSS.MATH.CONTENT.HSF.LE.A.1.A |
|---|---|
| Grade Range | 8 - 10 |
| Curriculum Nodes |
Algebra • Linear Functions and Equations • Graphs of Linear Functions • Slope-Intercept Form |
| Copyright Year | 2021 |
| Keywords | linear functions |