Display Title
Math Clip Art--Applications of Linear Functions: Cost vs. Time 09
Display Title
Math Clip Art--Applications of Linear Functions: Cost vs. Time 09

Topic
Linear Functions
Description
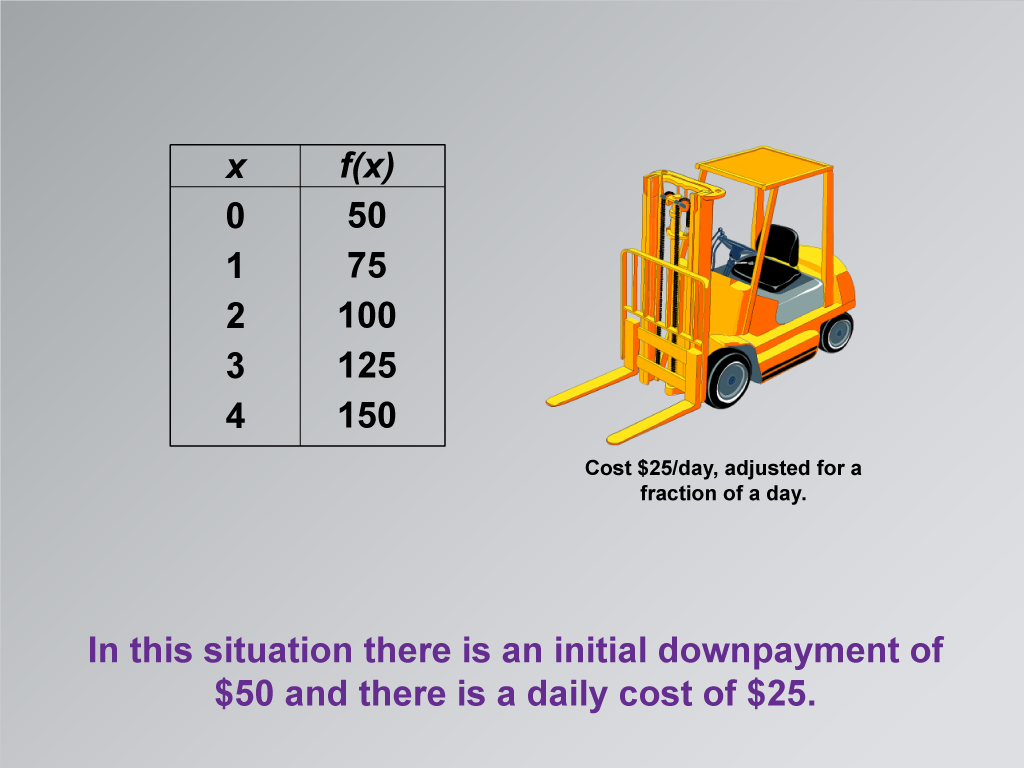
This math clip art image is the ninth in a series dedicated to illustrating applications of linear functions, specifically focusing on building a linear function model for equipment rental costs. The image introduces a new scenario within the construction equipment rental context, presenting a situation where there's an initial down payment in addition to a daily rental rate. It features construction equipment alongside a new data table, demonstrating how the linear function model adapts to include a fixed cost.
The caption explicitly states that there is an initial down payment of $50 and a daily cost of $25. This scenario introduces the concept of a y-intercept in the linear function, representing the fixed cost (down payment) that exists even when the rental period is zero days. The daily rate of $25 will form the slope of the line. This visual aid effectively demonstrates how real-world scenarios can lead to linear functions with non-zero y-intercepts, expanding on the previous examples in the series.
Using such math clip art in teaching linear functions is invaluable for helping students understand how different real-world scenarios translate into different forms of linear equations. This image bridges the gap between abstract mathematical concepts and practical applications, allowing students to see how initial costs and ongoing rates combine to form a complete linear model. Incorporating these visuals into lessons can significantly enhance student comprehension of how to interpret and create linear functions that model real-world situations, particularly those involving fixed costs and variable rates.
Teacher's Script
Let's examine this new rental scenario. We now have an initial down payment of $50 and a daily rate of $25. How do you think this will change our linear function? Consider how the down payment might affect our graph and equation. What will the y-intercept represent in this case? How will the slope of our line relate to the daily rate? Think about how we can use this information to write a new equation for this rental situation.
For a complete collection of math clip art related to Applications of Linear Functions click on this link: Applications of Linear Functions: Cost vs. Time Collection.
| Common Core Standards | CCSS.MATH.CONTENT.8.F.A.2, CCSS.MATH.CONTENT.8.F.A.3, CCSS.MATH.CONTENT.HSF.LE.A.1.A |
|---|---|
| Grade Range | 8 - 10 |
| Curriculum Nodes |
Algebra • Linear Functions and Equations • Graphs of Linear Functions • Slope-Intercept Form |
| Copyright Year | 2021 |
| Keywords | linear functions |