Display Title
Math Clip Art--Applications of Linear Functions: Cost vs. Time 10
Display Title
Math Clip Art--Applications of Linear Functions: Cost vs. Time 10

Topic
Linear Functions
Description
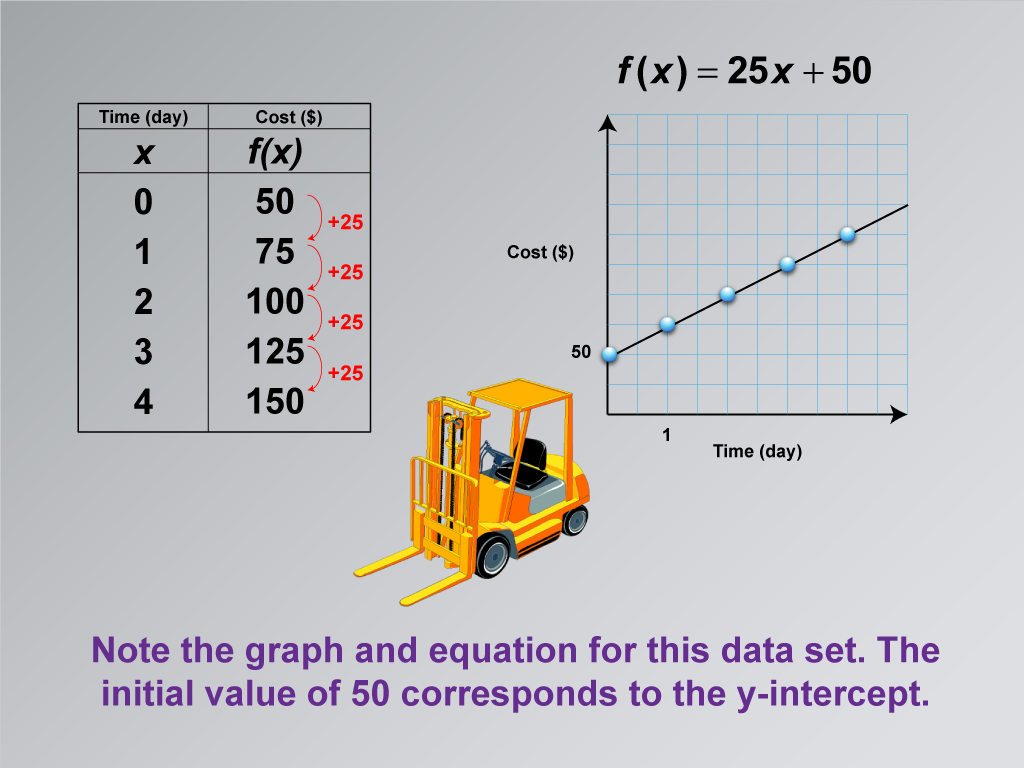
This math clip art image is the tenth and final in a series exploring applications of linear functions, focusing on building a linear function model for equipment rental costs. The image builds upon the previous scenario, now including a graph and the corresponding linear equation. It features construction equipment alongside a data table, a linear graph, and the function f(x) = 25x + 50, illustrating how the rental scenario with an initial down payment translates into a complete linear model.
The caption emphasizes that the initial value of $50 corresponds to the y-intercept in the graph and equation. This visual aid effectively demonstrates how the fixed cost (down payment) is represented as the y-intercept, while the daily rental rate of $25 forms the slope of the line. The equation f(x) = 25x + 50 encapsulates both these elements, providing a comprehensive mathematical model of the rental cost scenario. This image serves as a culmination of the series, showing how real-world data can be represented graphically and algebraically in a linear function.
Incorporating such math clip art into lessons on Linear Functions can significantly enhance student understanding of how different elements of a real-world scenario correspond to components of a linear equation and its graph. This image bridges the gap between practical situations and mathematical representations, allowing students to see the direct correlations between initial costs, ongoing rates, y-intercepts, and slopes. By presenting these connections in a relatable, real-world context, educators can make the learning process more engaging and memorable, helping students to develop a deeper appreciation for the practical applications of linear functions in modeling real-world phenomena.
Teacher's Script
Let's analyze this final image in our series. We can see how our rental scenario with a down payment and daily rate is represented in a graph and equation. Notice how the initial $50 down payment appears as the y-intercept, and the $25 daily rate forms the slope of our line. Can you explain why the equation takes the form f(x) = 25x + 50? How does this equation relate to our original rental terms? Think about how we could use this equation to calculate the total cost for any number of rental days. How does this example demonstrate the power of linear functions in modeling real-world situations?
For a complete collection of math clip art related to Applications of Linear Functions click on this link: Applications of Linear Functions: Cost vs. Time Collection.
| Common Core Standards | CCSS.MATH.CONTENT.8.F.A.2, CCSS.MATH.CONTENT.8.F.A.3, CCSS.MATH.CONTENT.HSF.LE.A.1.A |
|---|---|
| Grade Range | 8 - 10 |
| Curriculum Nodes |
Algebra • Linear Functions and Equations • Graphs of Linear Functions • Slope-Intercept Form |
| Copyright Year | 2021 |
| Keywords | linear functions |