Display Title
Math Clip Art--Applications of Linear Functions: Cricket Chirps 03
Display Title
Math Clip Art--Applications of Linear Functions: Cricket Chirps 03

Topic
Linear Functions
Description
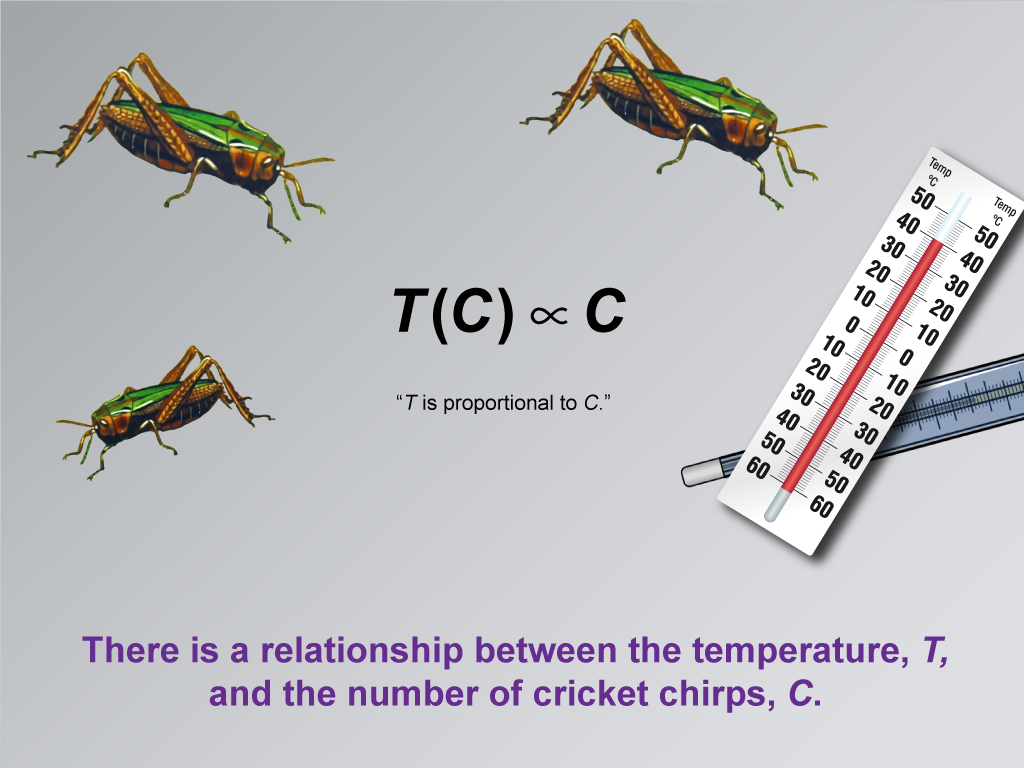
This image in the series on applications of linear functions illustrates the direct relationship between temperature (T) and the number of cricket chirps (C). It visually represents how these two variables are connected, laying the groundwork for developing a linear function model.
The use of math clip art to depict this relationship is particularly effective in helping students grasp the concept of dependent and independent variables in a real-world context. By visualizing how cricket chirps correspond to temperature changes, students can more easily understand the fundamental principles of linear functions and their applications in nature.
Teacher's script: "This image shows us that there's a direct relationship between the temperature and the number of cricket chirps. Let's think about this: as one variable changes, how does the other respond? Which do you think might be the independent variable, and which might be the dependent variable? Understanding this relationship is key to developing our linear function model."
For a complete collection of math clip art related to Applications of Linear Functions click on this link: Applications of Linear Functions: Cricket Chirps Collection.
| Common Core Standards | CCSS.MATH.CONTENT.8.F.A.2, CCSS.MATH.CONTENT.8.F.A.3, CCSS.MATH.CONTENT.HSF.LE.A.1.A |
|---|---|
| Grade Range | 8 - 10 |
| Curriculum Nodes |
Algebra • Linear Functions and Equations • Graphs of Linear Functions • Slope-Intercept Form |
| Copyright Year | 2021 |
| Keywords | linear functions |